
CARDIOVASCULAR JOURNAL OF AFRICA • Volume 29, No 6, November/December 2018
378
AFRICA
in the crude population at one-year follow up; (2) there were no
significant differences in rate of MACE and CD between the
two groups after propensity-score matching; (3) rates of major
bleeding complications were lower in the TRI than the TFI
group in both the crude and matched populations; (4) CKD and
MVD were independent predictors of MACE in patients with
NSTE-ACS, suggesting that clinical and angiographic profiles
rather than vascular access site are important in determining
clinical outcomes after intervention for NSTE-ACS.
The increasing adoption of radial access currently has
led to the inevitable debate on preferred vascular access site.
Although recent ACCF/AHA/SCAI PCI practice guidelines
strongly recommend the radial approach,
13
adoption of radial
access for PCI has been variable in different countries.
2
For
example, the radial route is predominant in Canada, France and
Days
0
90
180
270
360
Cumulative incidence of CD
0.10
0.08
0.06
0.04
0.02
0.00
Log-rank
p
=
0.888
TRI
TFI
No. at Risk
TRI
624
585
567
550
324
TFI
241
223
207
199
144
Days
0
90
180
270
360
Cumulative incidence of MI
0.10
0.08
0.06
0.04
0.02
0.00
Log-rank
p
=
0.204
TRI
TFI
No. at Risk
TRI
624
584
567
549
321
TFI
241
223
207
200
144
Days
0
90
180
270
360
Cumulative incidence of RR
0.10
0.08
0.06
0.04
0.02
0.00
Log-rank
p
=
0.247
TRI
TFI
No. at Risk
TRI
624
582
561
539
314
TFI
241
221
202
195
138
Days
0
90
180
270
360
Cumulative incidence of MACE
0.10
0.08
0.06
0.04
0.02
0.00
Log-rank
p
=
0.333
TRI
TFI
No. at Risk
TRI
624
582
560
539
314
TFI
241
221
202
194
138
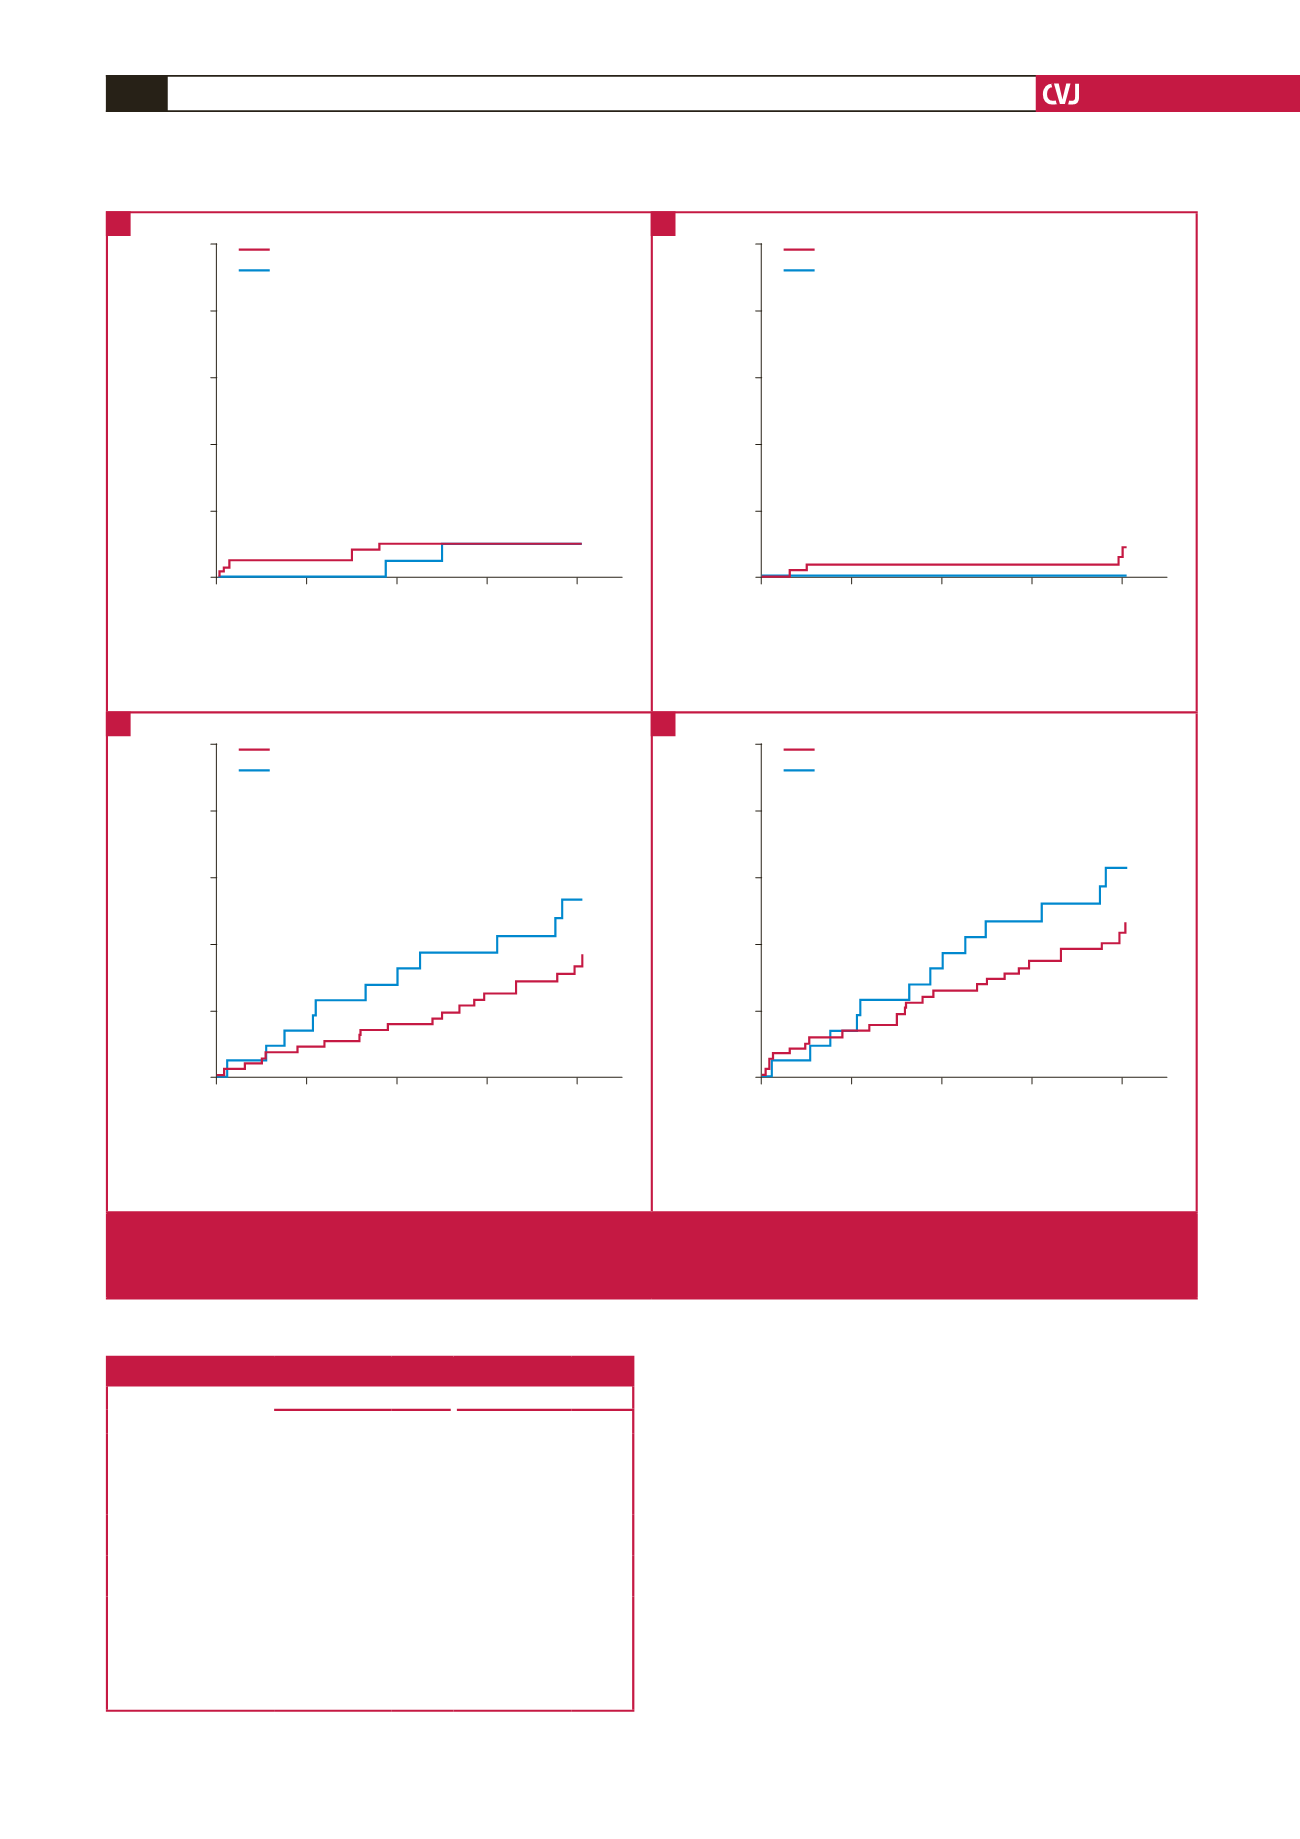
Fig. 2.
Kaplan–Meier curves of clinical outcomes at one year in the propensity-score matched population. A. cardiac death; B.
myocardial infarction; C. repeat revascularisation; D. MACE. TRI
=
transradial intervention; TFI
=
transfemoral intervention;
CD
=
cardiac death; MI
=
myocardial infarction; RR = repeat revascularisation; MACE
=
major adverse cardiovascular events.
A
C
B
D
Table 5. Independent predictors of MACE at one year
Univariate analysis
Multivariate analysis
HR (95% CI)
p
-value HR (95% CI)
p
-value
TRI
0.588
(0.347–0.995)
0.048
1.106
(0.532–1.939)
0.963
Diabetes mellitus
2.147
(1.305–3.533)
0.003
1.557
(0.913–2.656)
0.104
Chronic kidney disease
5.520
(2.877–10.591)
<
0.001
4.172
(1.822–9.551)
0.001
Multi-vessel disease
2.850
(1.546–5.254)
0.001
2.619
(1.416–4.843)
0.002
The following variables were considered in the model: TRI, older age (
≥
65
years), gender, hypertension, diabetes mellitus, dyslipidaemia, CKD, current
smoking, history of IHD, history of PAD, NSTEMI, multi-vessel disease (2VD
or 3VD). TRI
=
transradial intervention; IHD
=
ischaemic heart disease; PAD
=
peripheral artery disease; NSTEMI
=
non-ST-segment elevation myocardial
infarction; VD
=
vessel disease.


