


 46 / 62

CARDIOVASCULAR JOURNAL OF AFRICA • Volume 31, No 1, January/February 2020
44
AFRICA
hypertensive participants compared to the reference group
(non-hypertensive). About a quarter (26.9%) of hypertensive
patients had an increase in LA volume. Determinants of LA
volume were BMI, BSA, DBP, and LV septal thickness at
diastole in hypertension. Diastolic dysfunction was the only
independent predictor of LAR in hypertensive patients. Also,
we found no correlation between microalbuminuria and LA size
(volume) among hypertensive patients.
The LA length, surface area and volume were significantly
increased in patients with hypertension compared to the
controls. This finding was consistent with several reports that
showed that there is an increase in LA length and volume in
hypertension.
13,17,184,25
Contrary to the findings by Sun
et al.
in
China, changes in anterior–posterior and transverse diameters
were not significant.
12
There are possible explanations to these
differences, which include LA anatomical variations and severity
Table 3. Echocardiography parameters
Variable
Hypertensives (
n
=
52) Controls (
n
=
40)
p
-value
AOD (mm)
28.8 (26.6–31.0)
28.8 (26.5–31.4)
0.79
IVSD (mm)
9.2 (7.5–10.4)
8.4 (7.1–9.8)
0.28
IVSS (mm)
13.6 (12.7–15.3)
13.8 (12.1–15.0)
0.61
LVEDD (mm)
49.1 (45.0–54.0)
46.8 (43.1–51.0)
0.11
LVEDS (mm)
30.0 (25.9–34.7)
28.5 (25.5–32.6)
0.20
PWDD (mm)
9.4 (8.3–11.1)
8.6 (7.5–9.8)
0.89
PWDS (mm)
15.7 (13.8–17.3)
14.4 (12.7–15.9)
0.19
FS (%)
37.0 (34.2–42.0)
0.35 (0.31–0.40)
0.91
EF (%)
68.0 (61.2–74.0)
83.3 (66.7–76.0)
0.17
LVMI (g/m
2
)
86.0 (72.7–101.7)
73.3 (58.4–88.7)
0.01*
RWT
0.35 (0.32–0.44)
0.35 (0.31–0.35)
0.11
Peak E (cm/s)
75.3 (58.8–92.5)
80.0 (67.0–90.0)
0.43
Peak A (cm/s)
83.0 (62.2–96.0)
63.5 (51.0–83.7)
0.001*
E dec (ms)
199.0 (179.0–219.0)
189.0 (165.0–209.0)
0.23
IVRT (ms)
96.0 (83.5–105.0)
90.0 (78.0–101.0)
0.31
E/A ratio
0.89 (0.70–1.2)
1.24 (0.94–1.49)
<
0.0001*
S
′
lateral (m/s)
10.0 (7.0–12.0)
9.0 (8.0–12.0)
0.88
Lateral E
′
(m/s)
9.0 (7.0–11.0)
11.0 (9.0-15.0)
0.009*
Lateral A
′
(m/s)
11.0 (9.0–2.8)
9.0 (7.01–0.0)
0.002*
E/E
′
ratio
9.0 (6.9–10.7)
7.25 (5.7–8.8)
0.001*
Values are presented as median (interquartile range). *Statistically significant.
AOD, aortic root diameter; IVSD, interventricular septal diameter at diastole;
IVSS, interventricular septal diameter at systole; LVEDD, left ventricular end-
diastolic diameter; LVEDS, left ventricular end-systolic diameter; PWDD, poste-
rior wall diameter at diastole; PWDS, posterior wall diameter at systole; EF,
ejection fraction; FS, fractional shortening; LVMI, left ventricular mass index;
RWT, relative wall thickness; E, early mitral flow velocity; A, atrial contraction
velocity; dec, E wave deceleration time; IVRT, isovolumetric relaxation time; S
′
,
systolic myocardial velocity at lateral annulus; A
′
, myocardial velocity associated
with atrial contraction; E
′
, early diastolic myocardial velocity.
Table 4. Comparison of left atrial size between hypertensives and controls
Variable
Hypertensives
(
n
=
52)
Controls
(
n
=
40)
p
-value
LA anteroposterior diameter (mm) 38.1 (34.6–38.0) 36.7 (34.1–39.6) 0.064*
LA anteroposterior diameter
indexed BSA
19.8 (17.8–19.8) 19.1 (18.0–21.0) 0.148
LA transverse diameter (mm)
37.0 (32.7–49.8) 39.3 (34.6–42.8) 0.097*
LA longitudinal diameter (mm)
50.0 (45.0–55.0) 47.4 (44.0–51.8) 0.045
LA surface area (cm
2
)
17.9 (13.3–21.2) 15.5 (13.6–17.4) 0.003
LA volume, biplane (ml)
52.4 (38.9–65.7) 43.8 (35.2–48.5) 0.002
LA volume, biplane indexed BSA
(ml/m
2
)
28.1 (19.9–34.5) 22.9 (18.8–26.6) 0.003
*Statistically significant. LA, left atrial; BSA, body surface area.
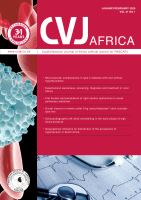
Hypertension
Control
Number
40
30
20
10
0
p
<
0.0001
14
38
39
1
LAE
no LAE
Fig. 3.
Proportion of patients with LA enlargement in hyper-
tensive subjects and controls. LAE, left atrial enlarge-
ment.
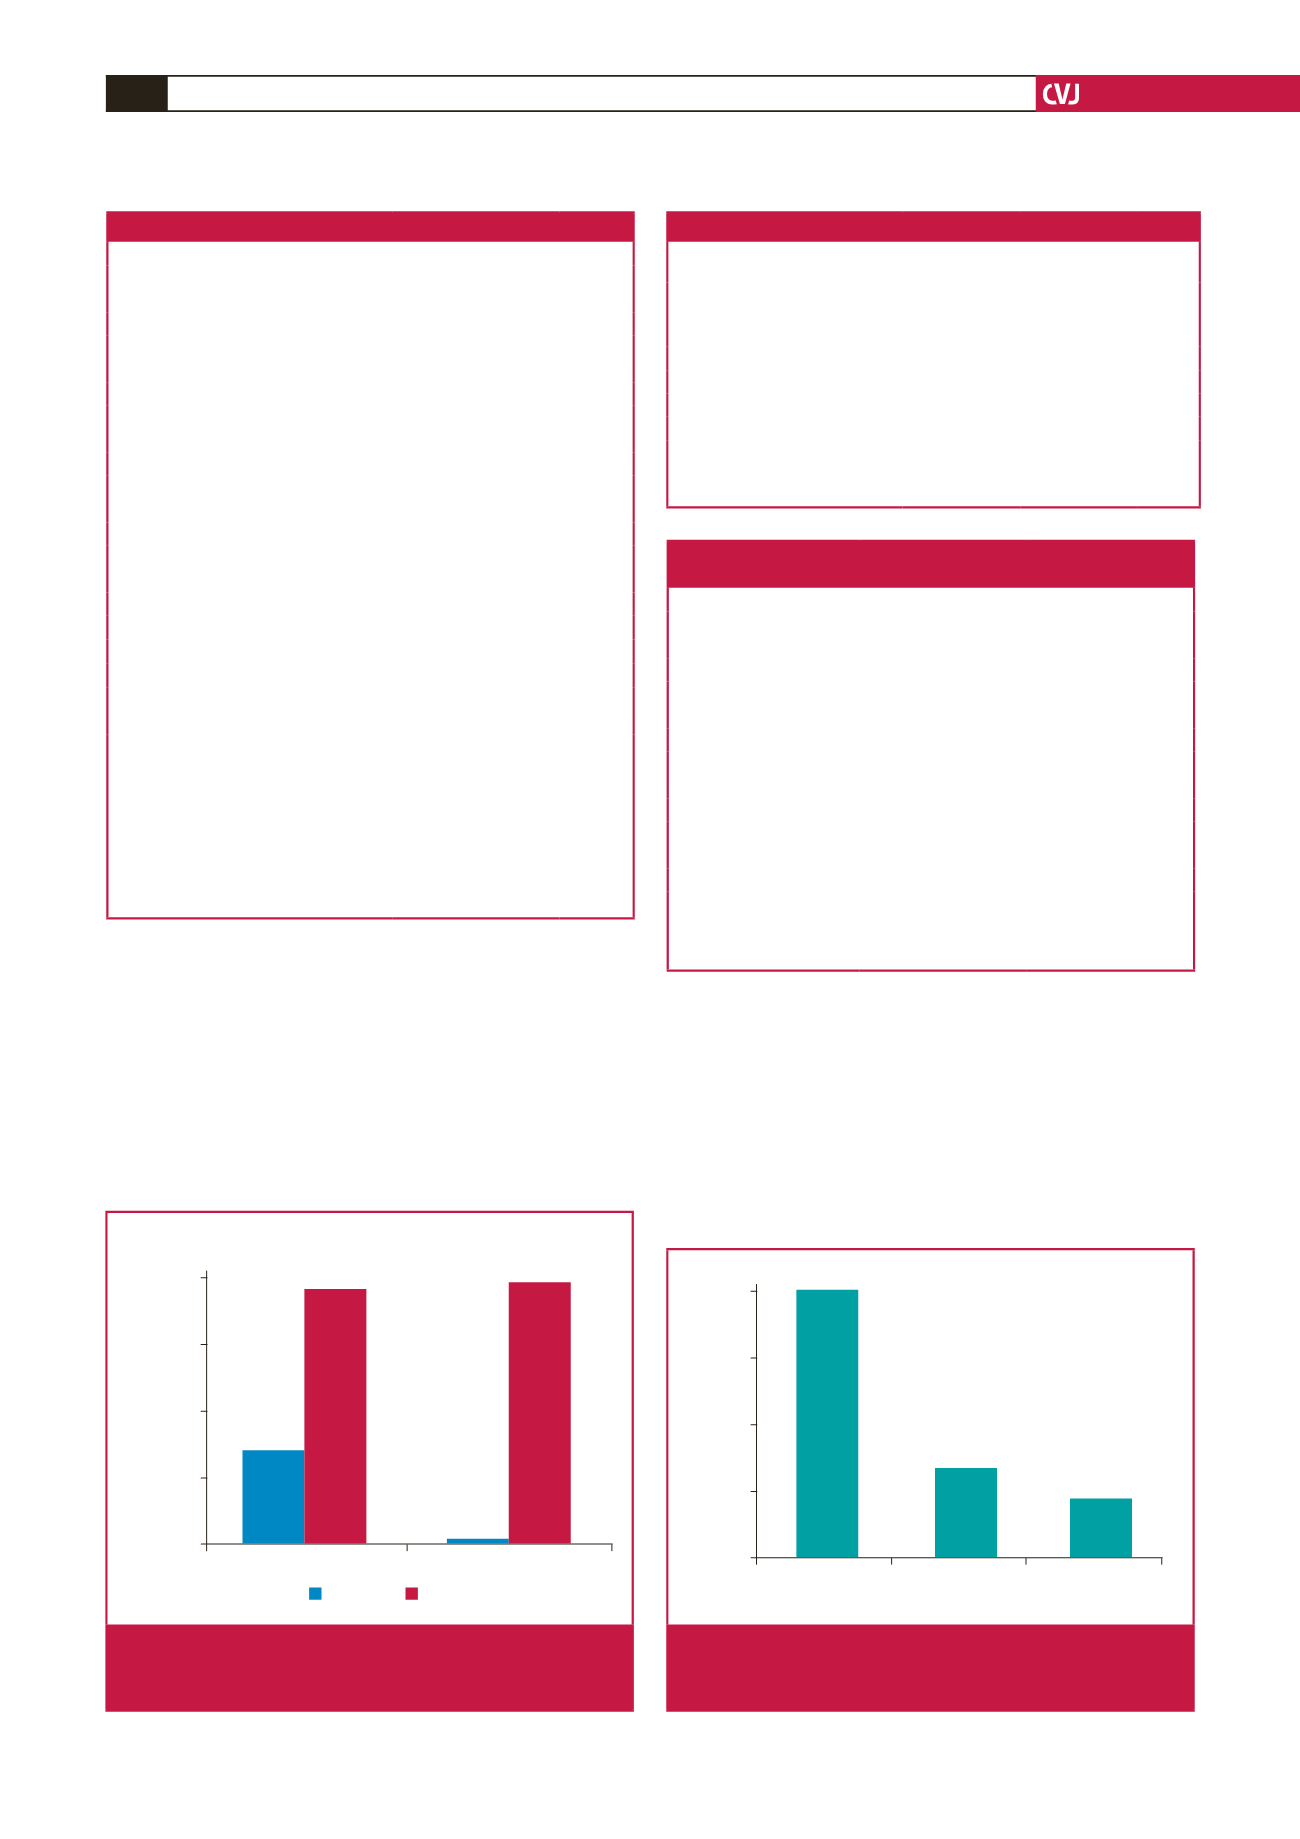
Mild LAE
Moderate LAE Severe LAE
Grade
9
7
5
2
0
9
3
2
Fig. 4.
Classification of severity of LA enlargement according
to the American Society of Echocardiography. LAE,
left atrial enlargement.
Table 5. Pearson correlation for covariates of left atrial size (volume)
in hypertensive patients
Variable
Correlation coefficient,
r
p
-value (
n
=
52)
Age
0.008
0.544
BMI
0.402
0.004*
SBP
–0.040
0.782
DBP
–0.300
0.019*
IVSD
–0.022
0.880
LEVDD
0.360
0.009
PWDD
1.310
0.366
LVM/BSA
0.055
0.704
E/E
0.351
0.013*
E/A
0.368
0.009
RWT
0.073
0.621
Microalbuminuria (mg/g)
0.130
0.350
*Statistically significant. BMI, body mass index; SBD, systolic blood pressure;
DBP, diastolic blood pressure; IVSD, interventricular septal diameter at diastole;
LVMI, left ventricular mass index; LVEDD, left ventricular end-diastolic diam-
eter; PWDD, posterior wall diameter at diastole; RWT, relative wall thickness.