


 52 / 62

CARDIOVASCULAR JOURNAL OF AFRICA • Volume 31, No 1, January/February 2020
50
AFRICA
inactive. The African race had a lower prevalence compared with
the other races. Urban dwellers, and those who had a medical
aid, or engaged in no physical exercise, or had ever smoked, or
had ever used alcohol, or whose BP measurements were taken in
winter had hypertension prevalences higher than their respective
counterparts. Those who were higher in the income band had
prevalences significantly higher than those in the lower income
level.
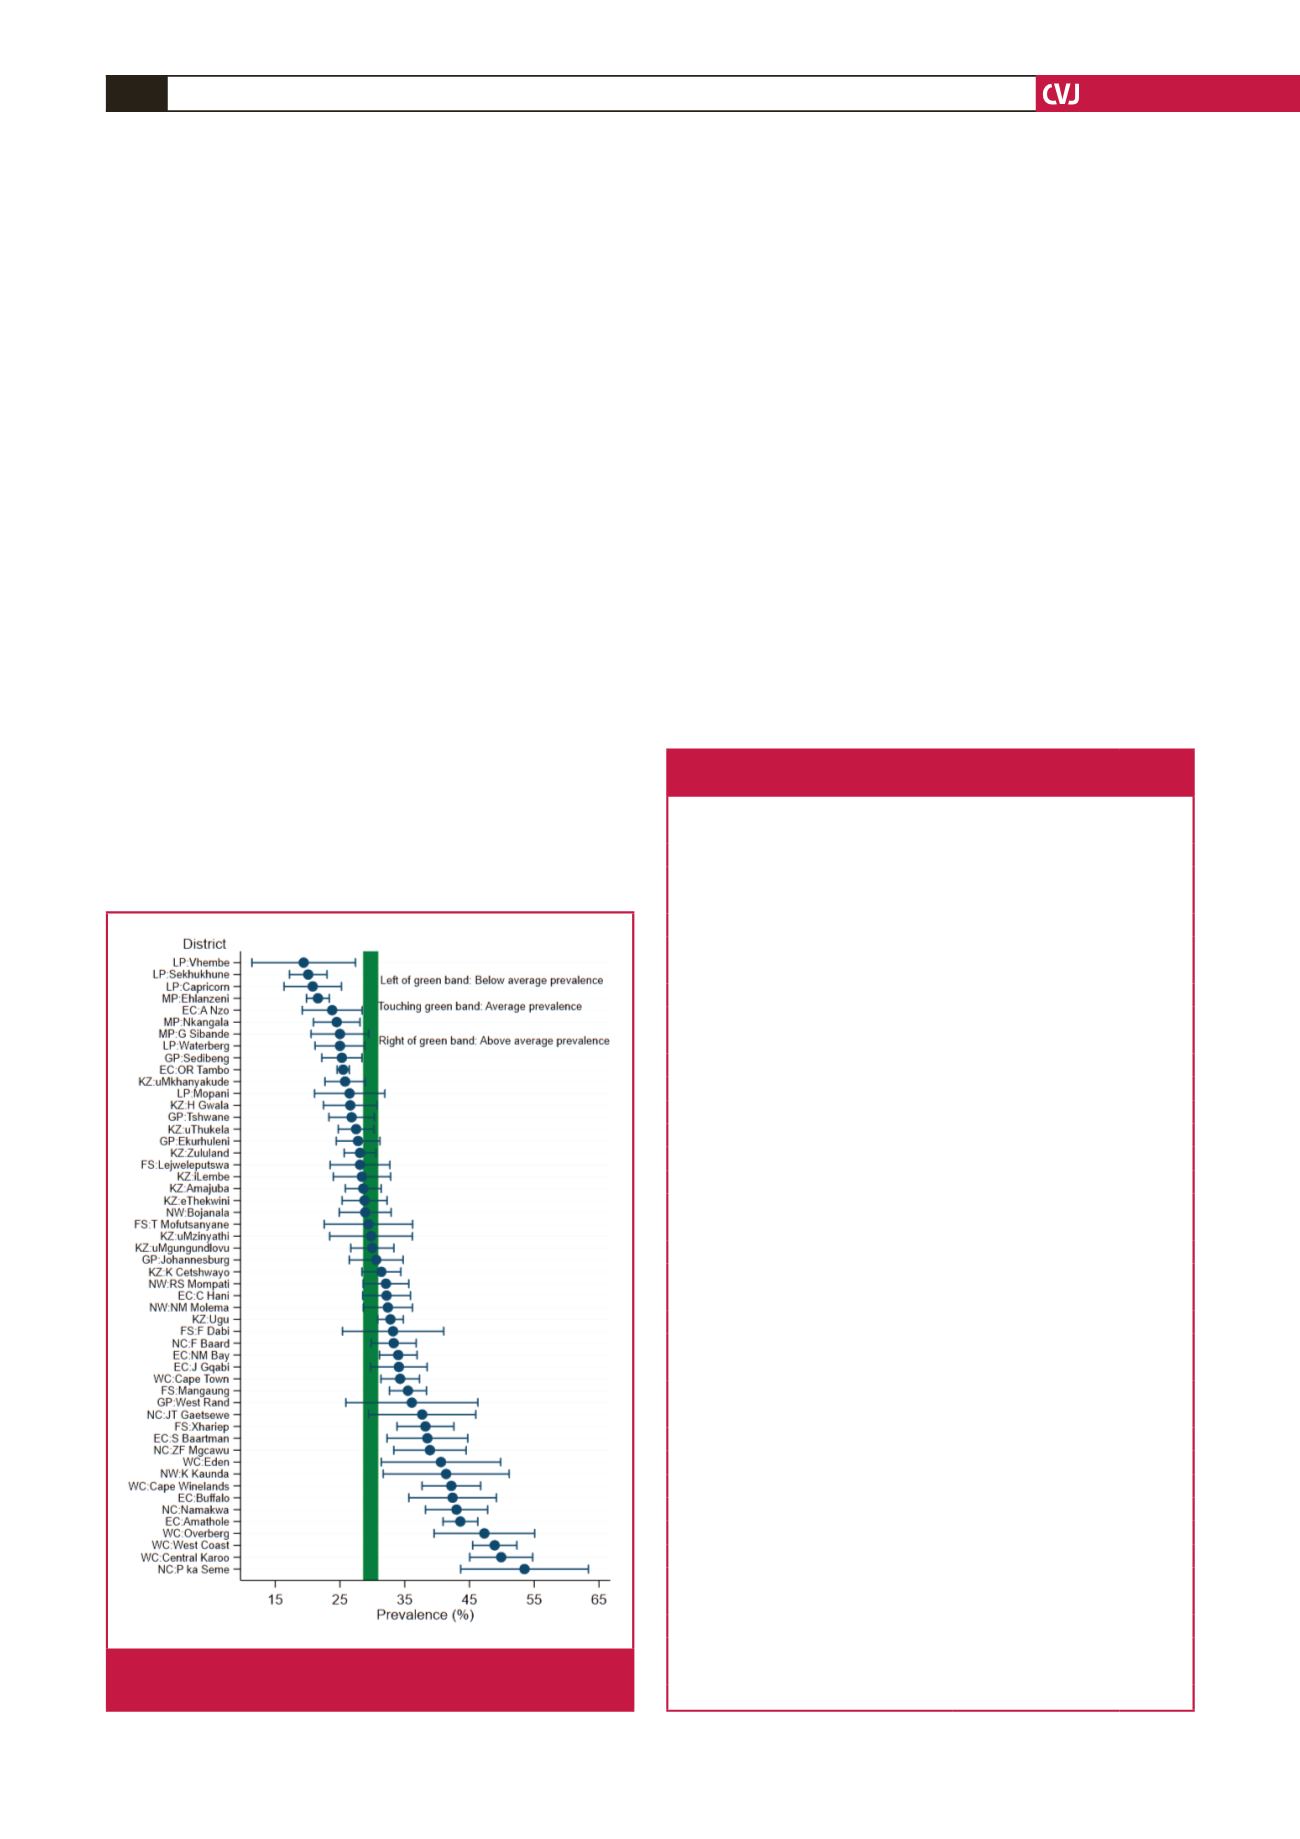
Fig. 1 shows the unadjusted weighted hypertension prevalence
and 95% CI for South African districts. The average national
prevalence was 29.8% (95% CI: 28.7–30.9%: green band).
Approximately eight districts showed a prevalence that was lower
than that of the national level, while about 16 districts showed a
prevalence that was significantly higher than that of the national
level. However these estimates are imprecise as characterised by
the large confidence intervals.
Except for A Nzo and OR Tambo (both in the Eastern Cape
Province), the districts with a lower-than-average prevalence
were found in the north-eastern provinces of Limpopo and
Mpumalanga. By contrast, the districts with a higher prevalence
than average were from the Western and Northern Cape
provinces. In between these two extremes lay the majority of
the districts whose prevalence was approximately equal to the
average. These districts were mostly found in KwaZulu-Natal,
Gauteng, parts of the Free State and Eastern Cape, and North
West provinces.
Factors associated with hypertension
: after accounting for other
factors, the greatest effect on hypertension was shown to
be basically from the demographic factors of age and race,
where the OR was approximately 5.5 times more for every five
years increase in age, while the Coloured and black African
populations, respectively, were about 2.5 and 1.5 times more
likely to be hypertensive compared with the combined races of
whites and Asians.
Other factors associated with hypertension prevalence were
BMI (OR
=
2.29,
p
=
0.001 for those with BMI at least 25.0
kg/m
2
), alcohol use (OR
=
1.25,
p
<
0.001), season (OR
=
1.33,
p
<
0.001 for winter vs autumn/spring) and residence (urban vs
traditional/farm, OR
=
1.12,
p
≤
0.011). Adjusted prevalence
was more likely to be lower for females compared with males
and decreased with level of education. Medical aid and smoking
status were not found to be significant predictors of hypertension
prevalence for these samples.
Hypertension variance
: Table 3 presents the distribution of
hypertension variance at the individual and district levels. Most
Fig. 1.
Design-based hypertension prevalence rates by
districts in South Africa.
Table 3. Fixed and random effects associated with
hypertension prevalence in South Africa
Factor
Odds ratio (95% CI) p-value
Period/year (vs 2008)
2010/11
0.72 (0.66–0.78)
0.000
2012
0.81 (0.75–0.88)
0.000
2014/15
0.75 (0.70–0.81)
0.000
2017
0.64 (0.59–0.70)
0.000
Gender (vs male)
Female
0.86 (0.80–0.92)
0.000
Age
1.11 (1.10–1.11)
0.000
Race (vs Asian/Caucasian)
African
1.52 (1.30–1.78)
0.000
Mixed race
2.56 (2.13–3.07)
0.000
Residency (vs traditional/farms)
Urban
1.12 (1.03–1.22)
0.011
Education level (vs pry and below)
High school
0.86 (0.80–0.93)
0.000
Certificate/diploma/Bachelors’+
0.76 (0.68–0.84)
0.000
Income tertile (vs low)
Medium
0.90 (0.85–0.96)
0.001
High
0.96 (0.89–1.03)
0.231
Employment status (vs employed)
Unemployed
0.97 (0.90–1.04)
0.375
Economically inactive
0.93 (0.87–0.99)
0.014
Has medical aid
1.01 (0.91–1.11)
0.861
BMI (vs
≤
normal weight)
Overweight/obesity (≥ 25 kg/m
2
)
2.29 (2.16–2.42)
0.000
Physical exercise (vs no exercise)
Some exercise
0.98 (0.92–1.03)
0.438
Alcohol use (vs never used)
Yes
1.25 (1.17–1.33)
0.000
Unknown
1.06 (0.93–1.20)
0.384
Smoking status (vs never smoked)
Ever smoked
1.00 (0.93–1.08)
0.920
Season (vs autumn/spring)
Summer
0.80 (0.76–0.85)
0.000
Winter
1.33 (1.26–1.40)
0.000
Random effects
District
0.11 (0.07–0.18)
Repeated observations
3.32 (3.13–3.51)