


 14 / 64

CARDIOVASCULAR JOURNAL OF AFRICA • Volume 31, No 6, November/December 2020
294
AFRICA
(0.11–0.56;
p
for linear trend < 0.0001), respectively (Table 4).
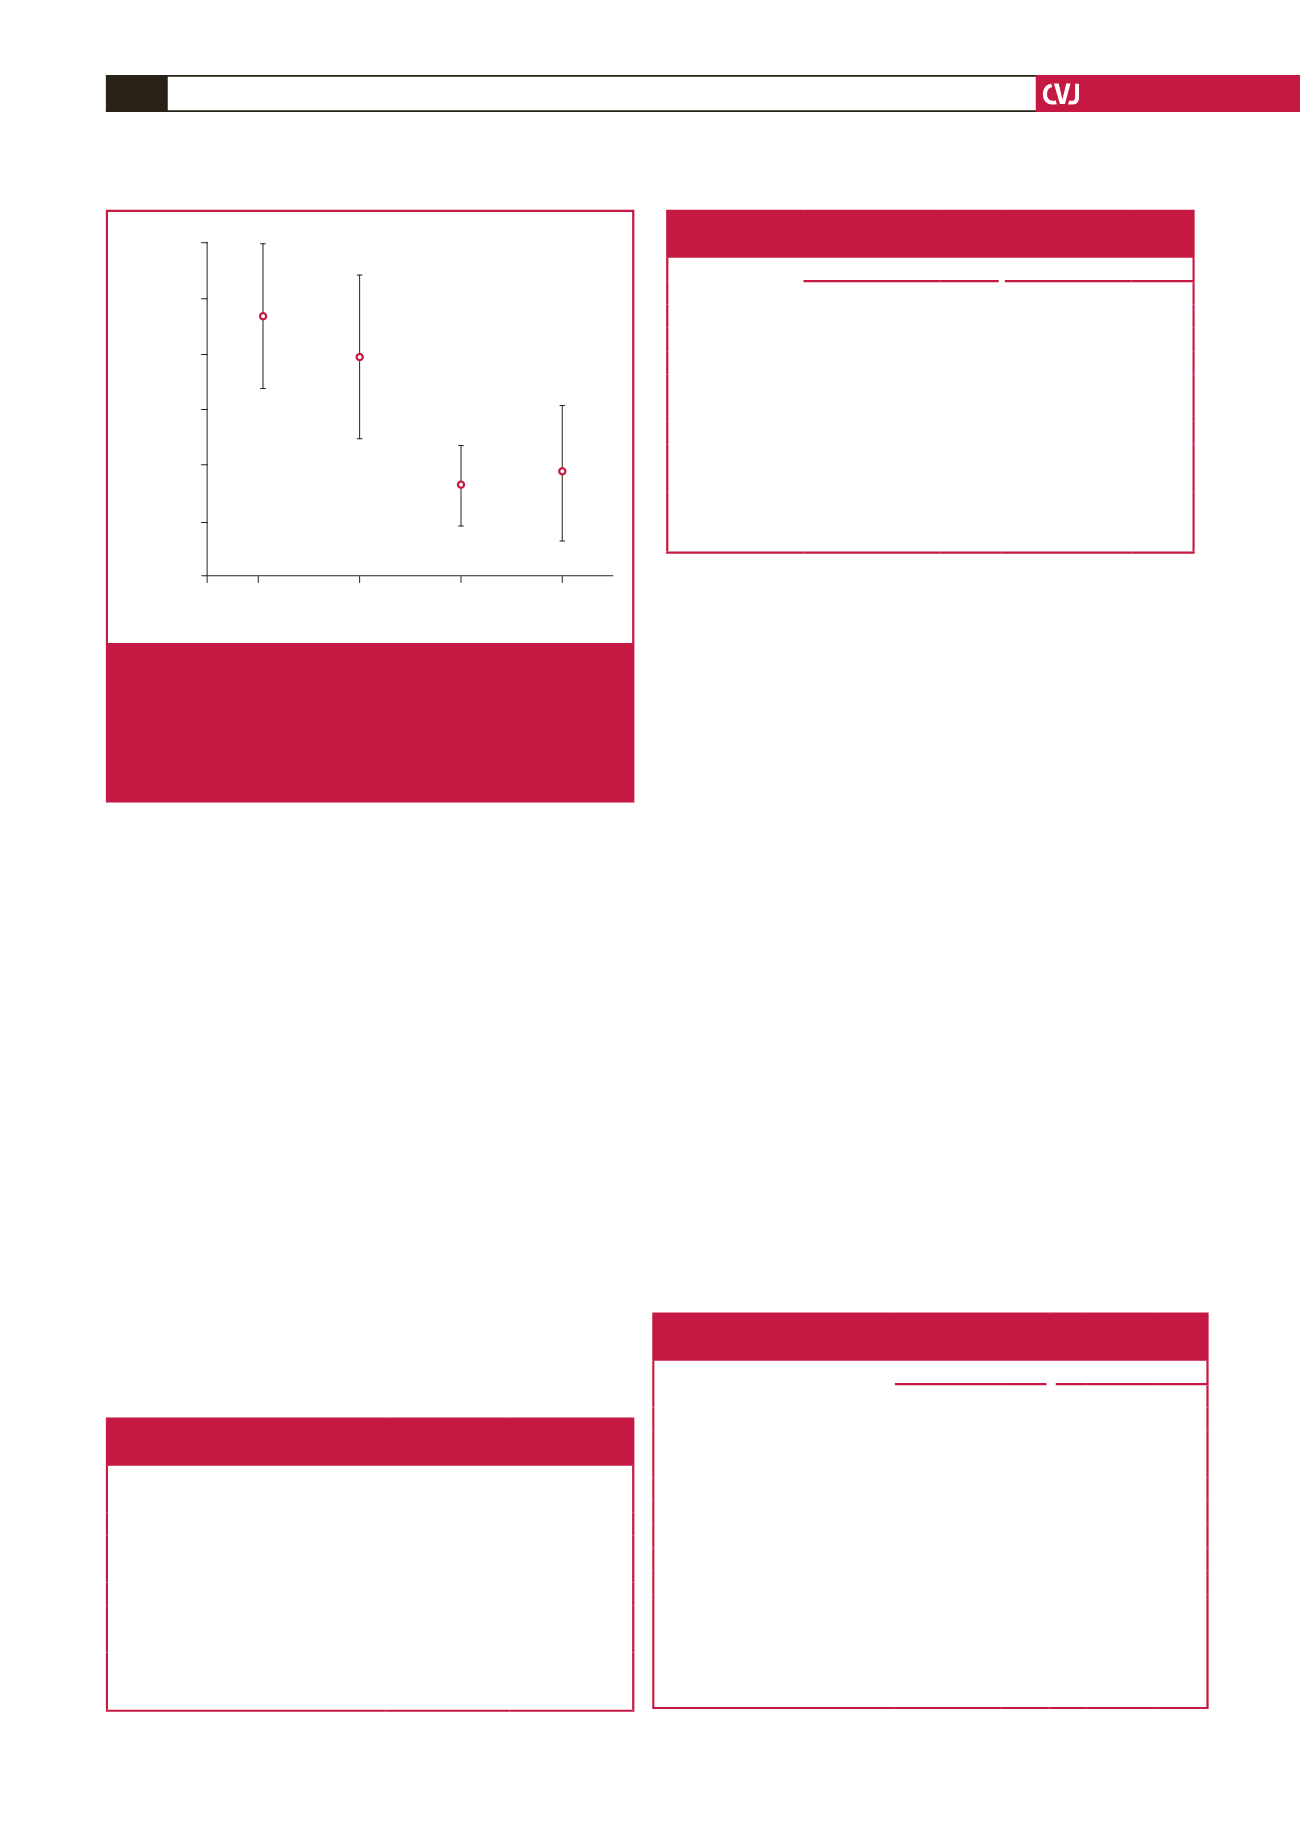
Fig. 2 illustrates the distribution of baseline HOMA-IR among
quartiles of NT-proBNP.
NT-proBNP and prospective association with diabetes:
the
relative risk of incident diabetes at re-examination decreased
significantly across quartiles of baseline values of NT-proBNP.
Compared with the lowest quartile of NT-proBNP, the OR (95%
CI) for incident diabetes in subjects belonging to quartiles two,
three and four was 0.54 (0.18–1.61), 0.43 (0.13–1.41) and 0.24
(0.06–0.96,
p
for linear trend = 0.041), respectively.
Bi-ethnic differences: in cross-sectional linear regression
analyses at baseline of the African subjects, each one SD increase
in baseline values of NT-proBNP was inversely associated with
body weight (
β
–3.52;
p
= 0.021), BMI (
β
–1.25;
p
= 0.019),
HbA
1c
(
β
–0.22;
p
= 0.027), insulin (
β
–1.76;
p
= 0.035) and TG (
β
–0.06;
p
= 0.002), and borderline associated with FPG (
β
–0.01;
p
= 0.062) (Table 5). In the cross-sectional linear regression
analyses at baseline of the Caucasian subjects, each one SD
increase in baseline values of NT-proBNP was significantly
inversely associated only with insulin (
β
–1.57;
p
= 0.015) and
HOMA-IR (
β
–0.52;
p
= 0.014) (Table 5).
In the African study participants, in cross-sectional age- and
gender-adjusted analyses at baseline, each one SD increment
of NT-proBNP was associated with reduced risk of prevalent
IGT (HbA
1c
: OR: 0.64; 95% CI: 0.44–0.92;
p
= 0.015),
hypertriglyceridaemia (OR: 0.61; 95% CI: 0.40–0.93;
p
= 0.022)
and insulin resistance (OR: 0.52; 95% CI: 0.35–0.77;
p
= 0.001)
(Table 6). In the Caucasian study participants, in cross-sectional
age- and gender-adjusted analyses at baseline, each one SD
increment of NT-proBNP was associated with reduced risk of
prevalent IGT (glucose: OR: 0.62; 95% CI: 0.43–0.89;
p
= 0.009),
the MetS (OR: 0.68; 95% CI: 0.49–0.96;
p
= 0.028) and insulin
resistance (OR: 0.64; 95% CI: 0.42–0.99;
p
= 0.046) (Table 6).
Discussion
In the SABPA study, undertaken in a middle-aged, bi-ethnic
cohort, we observed that NT-proBNP was inversely associated
with metabolic risk factors such as increased waist circumference
and BMI, hypertriglyceridaemia, hyperglycaemia and insulin
resistance. Moreover, in a prospective analysis, NT-proBNP
was inversely associated with incident diabetes, findings in line
with previous notions on NPs’ involvement in protection against
diabetes. Additionally, ethno-stratified analyses revealed that
low NT-proBNP levels in Africans were associated with several
metabolic conditions such as obesity, IGT, insulin resistance
and hypertriglyceridaemia, whereas low NT-proBNP levels in
Caucasians were associated with insulin resistance only.
The last two decades of research have demonstrated that
NPs play an important role in the control of energy usage,
20
and
Table 4. Associations of NT-proBNP quartiles
and prevalent insulin resistance
OR (95% CI)
p
-value
Continuous NT-proBNP
0.57 (0.43–0.76)
< 0.001
Dichotomous NT-proBNP
Q1 (lowest values)
Referent
Q2
0.83 (0.44–1.57)
0.564
Q3
0.30 (0.14–0.64)
0.002
Q4 (highest values)
0.25 (0.11–0.56)
0.001
p
for trend < 0.001
Age and gender adjusted. NT-proBNP = N-terminal pro-brain natriuretic
peptide; Q1 = quartile with the lowest NT-proBNP levels; Q4 = quartile with
the highest NT-proBNP levels.
Table 5. Bi-ethnic associations of one SD increment of NT-proBNP
and glucometabolic traits at baseline examination
Caucasian (
n
= 203)
African (
n
= 194)
Beta (SE)
p
-value
Beta (SE)
p
-value
Body weight (kg)
–0.70 (1.44)
0.628
–3.52 (1.20)
0.021
BMI (kg/m
2
)
–0.57 (0.46)
0.223
–1.25 (0,53)
0.019
Waist (cm)
–1.56 (1.10)
0.157
–2.06 (1.25)
0.101
HbA
1c
(%)
–0.061 (0.03)
0.052
–0.22 (0.10)
0.027
Glucose (mmol/l)
–0.01 (0.004)
0.072
–0.02 (0.01)
0.081
Insulin (μU/ml)
–1.57 (0.64)
0.015
–1.76 (0.83)
0.035
HOMA-IR
–0.52 (0.21)
0.014
–0.48 (0.27)
0.082
TG (mmol/l)
–0.03 (0.02)
0.124
–0.06 (0.02)
0.002
Linear regressions are adjusted for age and gender. NT-proBNP = N-terminal
pro-brain natriuretic peptide; BMI = body mass index; TG = triglycerides;
HOMA-IR = homeostatic model assessment of insulin resistance.
Quartiles of NT-proBNP
Q1
Q2
Q3
Q4
HOMA-IR
5.00
4.50
4.00
3.50
3.00
2.50
2.00
Fig. 2.
Distribution of baseline HOMA-IR among quartiles of
NT-proBNP. HOMA-IR
= homeostatic model assess-
ment of insulin resistance; NT-proBNP = N-terminal
pro-brain natriuretic peptide; Q1 = quartile with the
lowest NT-proBNP levels; Q4 = quartile with the high-
est NT-proBNP levels.
Table 6. Bi-ethnic associations of one SD of NT-proBNP increment and
glucometabolic states at baseline examination
Caucasian (
n
= 203) African (
n
= 194)
Dichotomous variables
OR 95% CI
p
-value OR 95% CI
p
-value
Waist
Caucasian cut-off
0.72 0.51–1.02 0.061 0.78 0.56–1.10 0.160
African cut-off
0.72 0.57–0.92 0.061 0.74 0.51–1.08 0.114
IGT (glucose > 5.6 mmol/l cut-off) 0.62 0.43–0.89 0.009 0.85 0.59–1.25 0.412
TG (TG >1.7 mmol/l cut-off)
0.66 0.42–1.04 0.075 0.61 0.40–0.93 0.022
Prevalent MetS
0.68 0.49–0.96 0.028 0.84 0.61–1.17 0.310
IGT (HbA
1c
> 5.7% cut-off)
0.92 0.64–1.33 0.657 0.64 0.44–0.92 0.015
Risk of belonging to HOMA-IR Q4 0.64 0.42–0.99 0.046 0.52 0.35–0.77 0.001
The results are calculated and presented for each ethnic group separately. Logistic
regressions are adjusted for age and gender. SD = standard deviation; NT-proBNP
= N-terminal pro-brain natriuretic peptide; IGT = impaired glucose tolerance; TG =
triglycerides; MetS = metabolic syndrome; HOMA-IR = homeostatic model assess-
ment of insulin resistance; Q4 = upper quartile of HOMA-IR. Ethnic waist cut-off
points are defined according to Alberti
et al.
19
and Botha
et al.
18