


 20 / 64

CARDIOVASCULAR JOURNAL OF AFRICA • Volume 31, No 6, November/December 2020
300
AFRICA
Results
We recruited 4 710 hypertensive patients (male 2 349 and female
2 361) with a mean age of 58 years in this cross-sectional study.
The mean age was 63 years in the 307 patients with stroke (male
151 and female 156) and 58 years in the 4 403 patients without
stroke (male 2 198 and female 2 205). The characteristics of the
4 710 hypertensive patients are shown in Table 1.
For females, there were significant associations between UA
level and stroke risk in M0, M1 and M2, with increasing ORs as
the quartiles increased, and the odds of stroke risk was highest
at Q4 in M2 (UA
>
396
μ
mol/l, OR: 3.05, 95% CI: 1.74–5.36).
However, there were no significant associations between UA
level and stroke risk for males in M0, M1 and M2. For all
participants, there were significant associations between UA level
and stroke risk only in M2, with significantly increasing ORs of
stroke risk across the quartiles (the highest OR was 2.13, 95%
CI: 1.42–3.20 for Q4).
A significant dose–response relationship between UA level
and stroke in all participants (
p
=
0.0010) was mainly driven by
females (
p
=
0.0008) but not by males. HU could significantly
increase stroke risk comparing with normo-uricaemia in all
participants (OR: 1.58, 95% CI: 1.20–2.09) and in females (OR:
1.89, 95% CI: 1.27–2.81) in M2 but not in males. Details are
shown in Table 2.
We observed significant associations between UA level and
IS for Q4 versus Q1 and Q3 versus Q1 in M2 in all participants
(OR: 1.99, 95% CI: 1.29–3.06 and OR: 1.69, 95% CI: 1.15–2.50)
and in females (OR: 3.19, 95% CI: 1.74–5.85 and OR: 2.06, 95%
CI: 1.22–3.47) but not in males. A significant dose–response
relationship between UA level and IS also existed in females and
all participants (
p
=
0.0007 and 0.0033) but not in males. Details
are shown in Table 3.
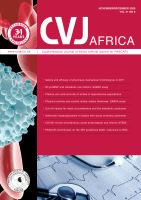
We also observed a significant association between HU and
IS with OR of 1.55 (95% CI: 1.15–2.08) in M2 (Fig. 1). However,
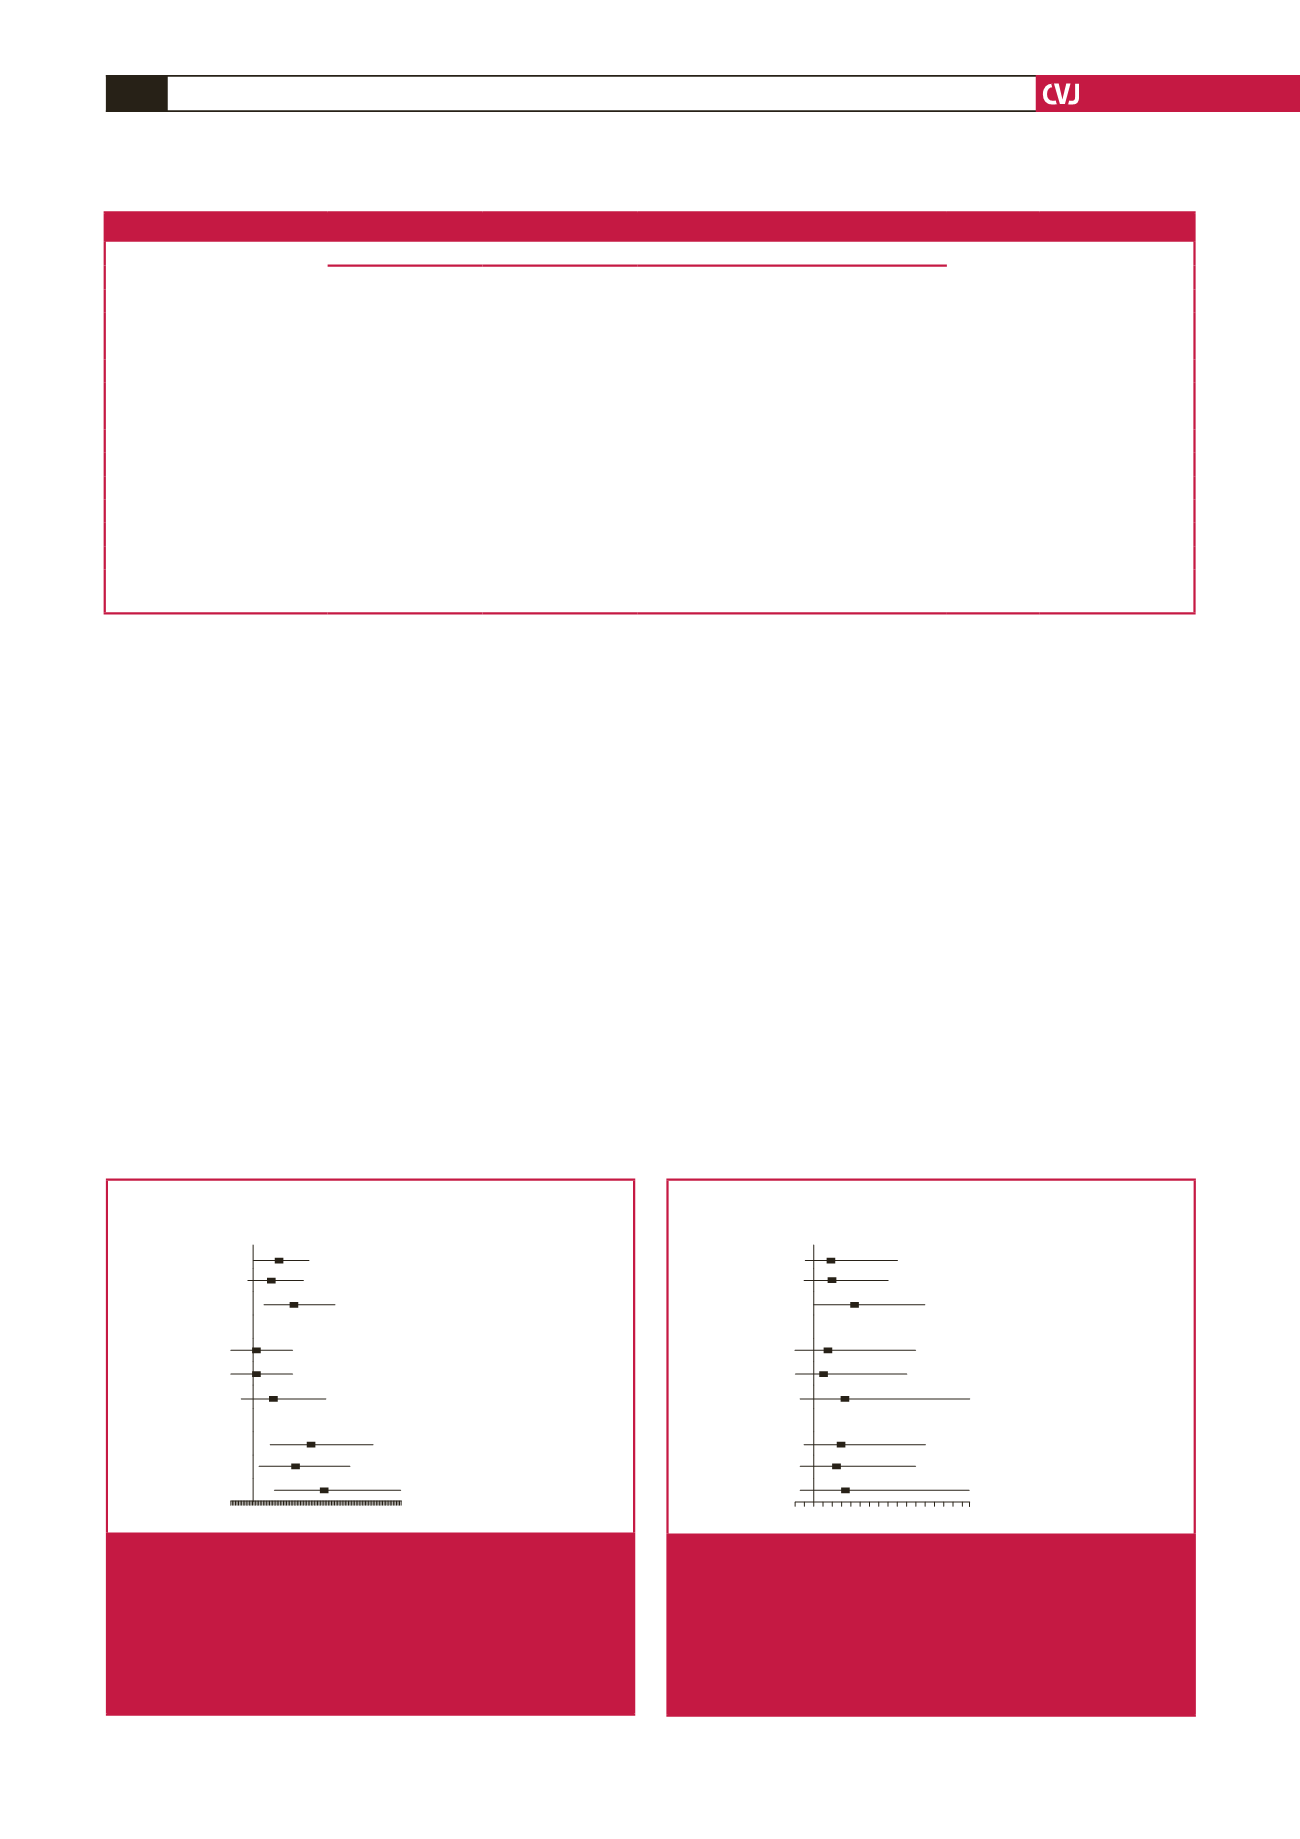
there was no significant association between HU and HS in M0,
M1 and M2 (Fig. 2).
As shown in Table 4, taking UA-Hcy-TG-TC-LDL-C- as
reference category, none of the combinations was significantly
associated with stroke risk for males. Combination
UA
+
Hcy
+
TG-TC-LDL-C- was significantly associated with
Table 2.The association between UA level and stroke risk
Variables
UA (
μ
mol/l)
p
-value
Hyperuricaemia vs
normo-uricaemia
Q1 (UA
≤
274) Q2 (274
<
UA
≤
332) Q3 (332
<
UA
≤
396) Q4 (UA
>
396)
Male (stroke/non-stroke)
19/269
27/461
50/663
55/805
151/2198
M0
1
0.83 (0.45–1.52)
1.07 (0.62–1.85)
0.97 (0.56–1.66)
0.7851
1.05 (0.74–1.50)
M1
1
0.87 (0.47–1.60)
1.10 (0.64–1.91)
1.01 (0.59–1.73)
0.8157
1.07 (0.75–1.53)
M2
1
0.89 (0.47–1.67)
1.27 (0.71–2.28)
1.40 (0.76–2.58)
0.3426
1.34 (0.90–2.00)
Female
45/856
40/639
36/429
35/281
156/2205
M0
1
1.19 (0.77–1.845)
1.60 (1.01–2.51)
2.37 (1.49–3.76)
0.0018
1.80 (1.27–2.55)
M1
1
1.14 (0.74–1.773)
1.42 (0.90–2.24)
2.04 (1.27–3.25)
0.0209
1.58 (1.11–2.25)
M2
1
1.26 (0.80–2.008)
1.81 (1.10–2.97)
3.05 (1.74–5.36)
0.0008
1.89 (1.27–2.81)
Total
64/1125
67/1100
86/1092
90/1086
307/4403
M0
1
1.07 (0.75–1.52)
1.38 (0.99–1.93)
1.46 (1.05–2.03)
0.0633
1.36 (1.06–1.75)
M1
1
1.07 (0.75–1.53)
1.36 (0.96–1.93)
1.46 (1.03–2.08)
0.0996
1.30 (1.01–1.67)
M2
1
1.19 (0.82–1.72)
1.69 (1.17–2.45)
2.13 (1.42–3.20)
0.0010
1.58 (1.20–2.09)
M0: crude model not adjusted, M1: model 1 adjusted by age and gender, M2: model 2 adjusted by age, gender, BMI, TG, TC, LDL-C, Cr, glucose, Hcy, heart ratio,
SBP, DBP, drinking, smoking, sport, heart failure, kidney disease, hypertensive retinopathy, diabetes, family history of stroke and hypertension years. Q: quartile.
variable IS
OR (95% CI)
p
OR
Total
272
M0
1.35 (1.03, 1.75) 0.0276 1.35
M1
1.26 (0.97, 1.65) 0.0845 1.26
M2
1.55 (1.15, 2.08) 0.0039 1.55
Male
137
M0
1.03 (0.71, 1.50) 0.8845 1.303
M1
1.04 (0.72, 1.52) 0.8240 1.04
M2
1.28 (0.84, 1.96) 0.2485 1.28
Female 135
M0
1.80 (1.24, 2.61) 0.0020 1.80
M1
1.56 (1.07, 2.28) 0.0215 1.56
M2
1.96 (1.29, 299) 0.0017 1.96
0.710.861.011.161.311.461.611.761.9122.092.242.392.542.692.842.99
Fig. 1.
Forest plot showing associations between UA and IS.
M0: crude model not adjusted. M1: model 1 adjusted by age
and gender. M2: model 2 adjusted by age, gender, BMI, TG,
TC, LDL-C, Cr, glucose, Hcy, heart ratio, SBP, DBP, drinking,
smoking, sport, heart failure, kidney disease, hypertensive
retinopathy, diabetes, family history of stroke and hyperten-
sion years.
variable HS
OR (95% CI)
p
OR
Total
35
M0
1.49 (0.74, 3.01) 0.2637 1.49
M1
1.56 (0.77, 3.16) 0.2187 1.56
M2
2.15 (0.97, 4.73) 0.0580 2.15
Male
14
M0
1.29 (0.43, 3.87) 0.6472 1.29
M1
1.26 (0.42, 3.77) 0.6838 1.26
M2
1.81 (0.53, 6.15) 0.3400 1.81
Female 21
M0
1.80 (0.72, 4.48) 0.2083 1.80
M1
1.65 (0.66, 4.17) 0.2858 1.65
M2
2.05 (0.70, 6.00) 0.1893 2.05
0.2 1.02 1.62 2.22 2.82 3.42 4.02 4.02 5.22 5.82
Fig. 2.
Forest plot showing associations between HU and HS.
M0: crude model not adjusted, M1: model 1 adjusted by age
and gender, M2: model 2 adjusted by age, gender, BMI, TG,
TC, LDL-C, Cr, glucose, Hcy, heart ratio, SBP, DBP, drinking,
smoking, sport, heart failure, kidney disease, hypertensive
retinopathy, diabetes, family history of stroke and hyperten-
sion years.