


 25 / 60

CARDIOVASCULAR JOURNAL OF AFRICA • Volume 32, No 1, January/February 2021
AFRICA
23
birth weight was documented in 3 643 (94.5%) neonates and
ranged from 0.69 to 5.1 kg with a mean of 3.08 ± 0.6 kg. The
mean lengths and OFC were 48.9 ± 2.9 cm and 34.5 ± 1.7 kg,
respectively. The mothers had a mean age of 28.6 ± 8.4 years and
a median parity of 2.0 ± 1.9 (Table 1).
Almost two-thirds of the neonates (2 340/3 857 or 60.7%)
were delivered in JUTH and PSSH. The remainder (1 517 or
39.3%) were delivered elsewhere but seen in these hospitals and
were either admitted or came for their first immunisation within
the first week of life in either of the two study centres. Over 80%
(1 262/1 517) of the latter were born in smaller hospitals while
the remaining 255 (16.8%) were born at home. Approximately
10% (388) of the overall 3 857 neonates were admitted for
in-patient care (Table 2).
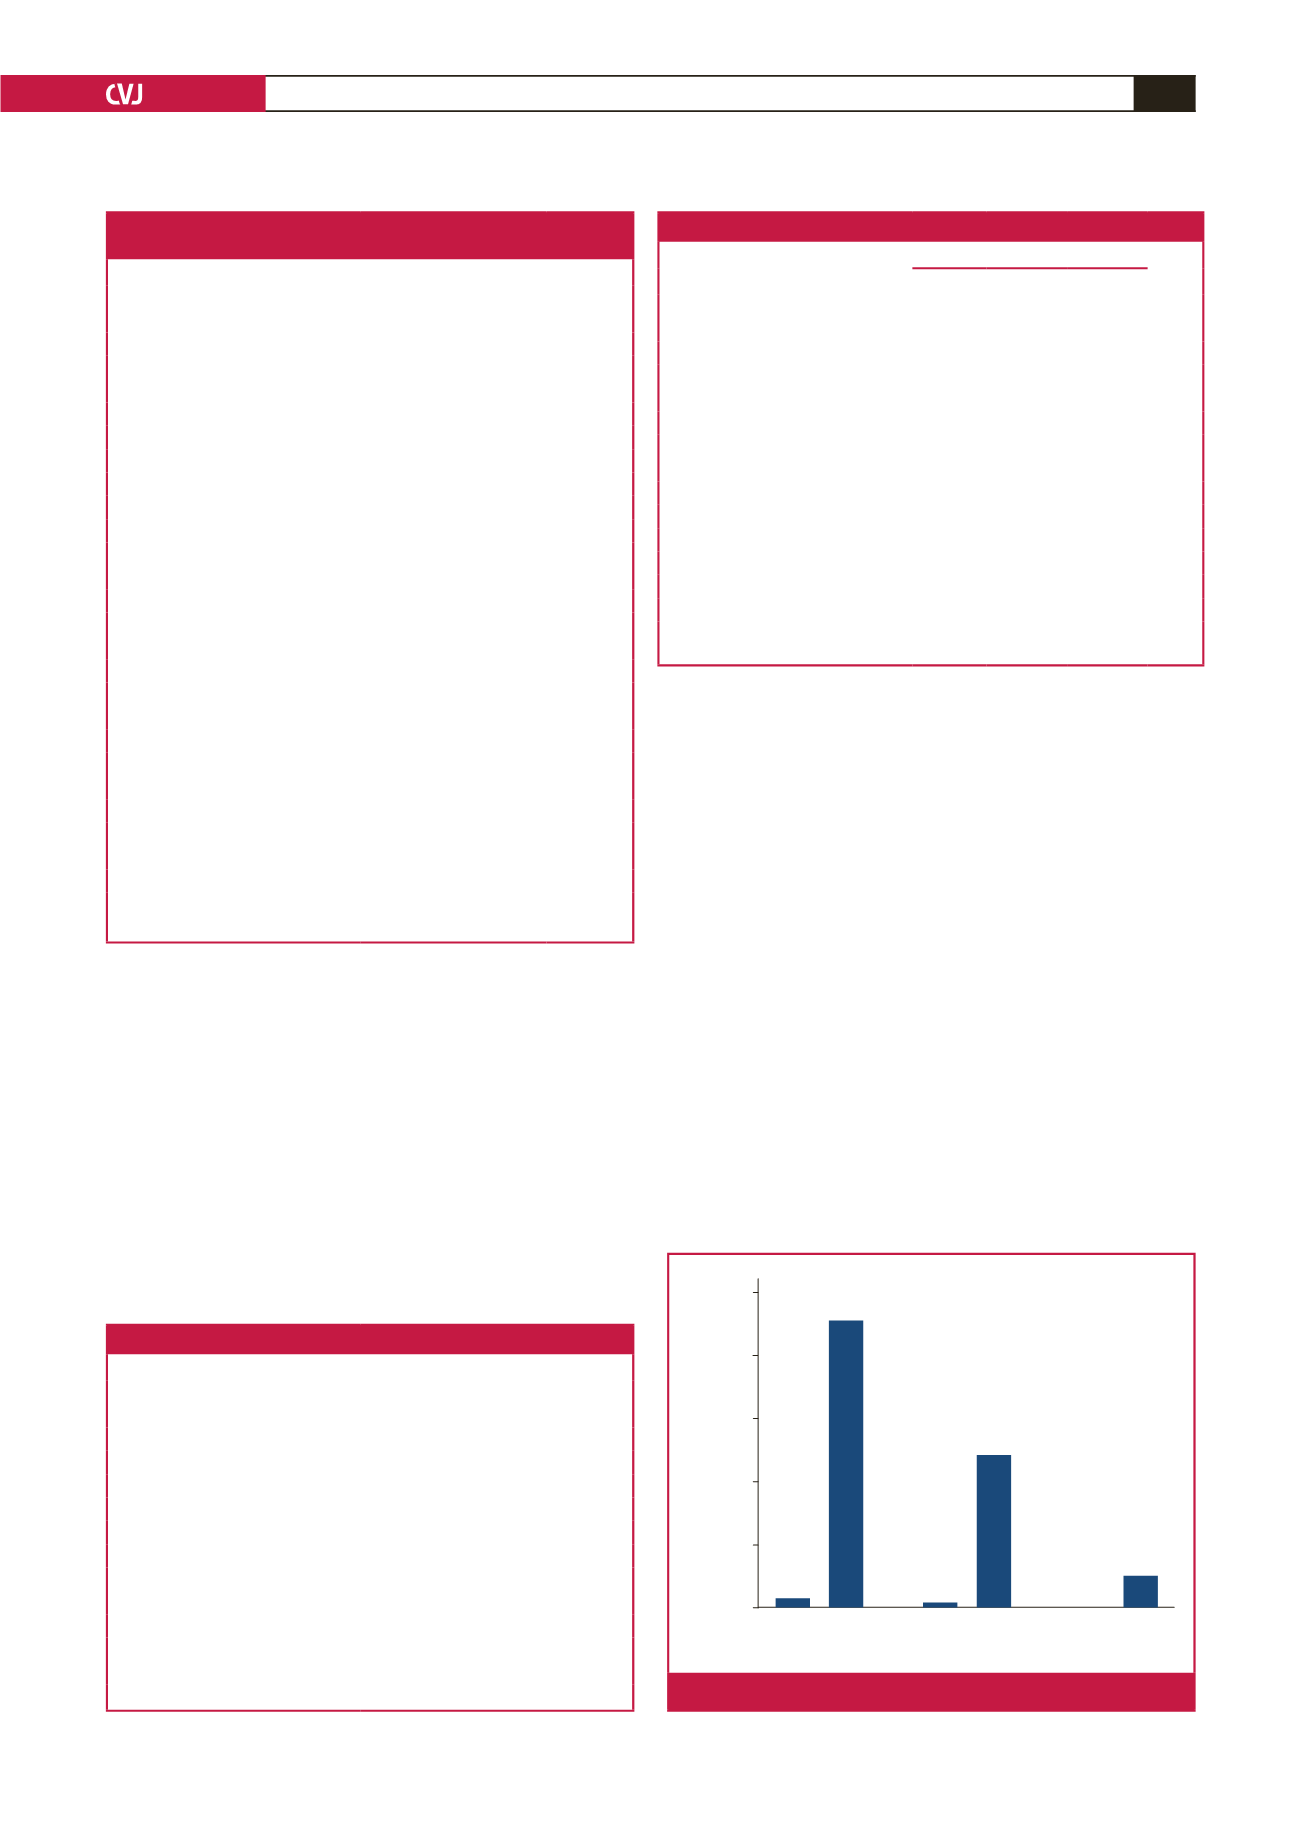
CHD was detected in 111 of the 3 857 neonates with a
prevalence of 28.8 per 1 000. Sixty-two (55.9%) males had CHD
(male-to-female ratio 1.3:1) (Table 3). Sixty-four of the 2 340
neonates delivered in JUTH and PSSH had CHD, with a hospital
birth prevalence of 27.4 per 1 000 live births. Conversely, CHD was
present in 42 of the 1 262 neonates delivered in other hospitals,
with a prevalence of 33.3 per 1 000, while five of the 255 neonates
delivered at home had CHD, prevalence 19.6 per 1 000 (Fig. 1).
Nine (8.1%) of the 111 neonates with CHD had cyanotic
defects, which is a prevalence of 2.3 per 1 000; six (66.7%) of
these had critical CHD, with a prevalence of 1.6 per 1 000
population. Only one of the six neonates with critical CHD was
delivered in either of the study institutions with a hospital birth
prevalence of 0.3 per 1 000 live births. The most common critical
CHD in this study was HLHS observed in four (66.7%) of the
six affected neonates (Table 4).
Acyanotic CHD contributed 91.9% of all the CHD detected,
being observed in 102 of the 111 neonates with CHD, which is a
prevalence of 26.4 per 1 000. The most common acyanotic CHD
Table 1. Demographic and clinical parameters
of neonates and their mothers
Parameter
Mean ± SD (95% CI)
Range
Gestational age at delivery (weeks)
36.9 ± 9.2
23–44
Preterm
583 (15.1)
Term
2988 (77.4)
Post term
72 (2.0)
Unknown
214 (5.5)
Neonatal age (days)
2.2 ± 1.9
1–7
Gender
Male
2016 (52.3)
Female
1841 (47.7)
Neonatal birth weight (kg)
3.08 ± 0.6
0.69–5.1
Low birth weight
352 (9.1)
Normal birth weight
3,189 (82.7)
Macrosomia
102 (2.6)
Not documented
214 (5.6)
Neonatal length (cm)
48.9 ± 2.9
32–62
< 45
271 (7.0)
45–55
3550 (92.1)
> 55
36 (0.9)
Occipitofrontal circumference (cm)
34.5 ± 1.7
28–40
< 33
339 (8.8)
33–37
3452 (89)
> 37
66 (1.7)
Parity
2.8 ± 1.9
1–14
Maternal age (years)
28.6 ± 8.4
15–52
< 18
11 (0.3)
18–35
3264 (84.6)
> 35
514 (13.3)
Unknown
68 (1.8)
Table 2. Distribution based on place of delivery and type of care received
Number (3 857)
Percentage
Place of delivery
JUTH/PSSH
2 340
60.7
Other hospitals
1 262
32.7
Home
255
6.6
In-patient care
Yes
388
10.1
JUTH/PSSH
244
62.9
Other hospitals
120
30.9
Home
24
6.2
No
3 469
89.9
JUTH/PSSH
2 096
60.4
Other hospitals
1 142
32.9
Home
231
6.7
JUTH, Jos University Teaching Hospital; PSSH, Plateau State Specialist Hospital.
Table 3. Factors associated with the severity of lesions
CHD
Characteristics
Mild* Moderate** Severe***
p-
value
n
(%)
n
(%)
n
(%)
Gender
Male
32 (51.6) 16 (25.8) 14 (22.6)
Female
32 (65.3) 11 (22.4)
6 (12.3)
0.27
Place of delivery
JUTH/PSSH
42 (65.6) 14 (21.9)
8 (12.5)
Other hospitals
20 (47.6) 12 (28.6) 10 (23.8)
Home
2 (40.0)
1 (20.0)
2 (40.0)
0.25
In-patient care
Yes
12 (34.3) 11 (31.4) 12 (34.3)
No
52 (68.4) 16 (21.1)
8 (10.5)
0.001
§
Maternal age in years (mean ± SD)
30.5 ± 5.7 29.2 ± 5.1 33.1 ± 5.4 0.06
Neonatal weight in kg (mean ± SD)
2.8 ± 0.6 2.7 ± 0.7 3.1 ± 0.5 0.09
Gestational age in weeks (mean ± SD) 36.3 ± 9.7 35.2 ± 10.4 34.6 ± 11.9 0.77
*17.9 per 1 000 live births; **6.0 per 1 000 live births; ***3.4 per 1 000 live births;
§
statistically significant.
2 500
Frequency
2 000
1 500
1 000
500
CHD No CHD
JUTH/PSSH
CHD No CHD
Other hospitals
CHD No CHD
Home
0
Fig. 1.
Distribution of CHD by place of delivery