CARDIOVASCULAR JOURNAL OF AFRICA • Vol 23, No 5, June 2012
266
AFRICA
out a holistic study on aging in the city of Dakar. To do so, face-
to-face guided interviews based on a questionnaire were used
to collect the data required for the study. These interviews were
followed by a physical examination that involved taking blood
pressure and anthropometric measurements.
Study definitions and measurements
Blood pressure was measured twice for each participant in
the course of a single visit. The first measurement was taken
mid-way through the interview, just after the questions related
to individual health. The second measurement was taken at the
end of the questionnaire, after about 15–20 minutes’ rest. These
measurements were taken by medical and pharmacy students in
Dakar, using an Omron
®
M3 Intellisense device validated by the
International Protocol.
20
The mean of the two measurements was
used for the analyses.
In accordance with the Seventh Report of the Joint National
Committee of Prevention, Detection, Evaluation, and Treatment
of High Blood Pressure, individuals with systolic blood pressure
≥
140 mmHg and/or diastolic blood pressure
≥
90 mmHg and/
or who reported the current use of antihypertensive medication
were considered to be suffering from high blood pressure.
21
Weight was measured using a digital scale (accuracy of 100
g) with subjects dressed in minimum clothing and barefoot. To
measure height, the subject was asked to stand ‘at attention’,
arms at the sides, heels together and without shoes. Following
World Health Organisation recommendations, body mass index
(BMI) was calculated by dividing weight (kg) by the square of
the height (m
2
). Overweight was defined as 25
≤
BMI
<
30 kg/
m
2
; obesity corresponded to a BMI of
≥
30 kg/m
2
.
22
Given the large proportion of people who had not visited a
doctor in the year preceding the interview (48%), the frequency of
doctor visits was split into two groups, as in the study conducted
by the hypertension study group in India and Bangladesh.
17
Therefore, people who had not visited a doctor in the year
preceding the interview were distinguished from those who had
seen a doctor at least once during the year.
Among the socio-demographic data collected during the
interviews, four variables were taken into account for this
study: age, gender, educational level and marital status. Three
age groups were defined: 50–59, 60–69 and 70 years and over.
Gender was coded as follows: 1 for women, 0 for men. Three
levels of education were defined: none, one to eight years of
schooling, more than eight years of schooling. Marital status was
coded as follows: married
=
0, other
=
1.
Statistical analysis
To answer our research questions, we used Chi-square tests and
logistic regressions. The software used for the statistical analysis
was PASW Statistics 18.
TABLE 1. CHARACTERISTICS OF THE SAMPLE (
n
=
500)
Variable
Category
Total,
n
(%)
Men,
n
(%)
Women,
n
(%)
Analysis
Age (years)
50–59
268 (53.6)
144 (54.7)
124 (52.3)
Chi
2
(2 df)
=
0.41;
NS
60–69
136 (27.2)
71 (27)
65 (27.4)
≥
70
96 (19.2)
48 (18.3)
48 (20.3)
Educational level
None
228 (45.6)
97 (36.9)
131 (55.3)
c
2
(2 df)
=
29.46;
p
<
0.001
1–8 years
186 (37.2)
100 (38.0)
86 (36.3)
≥
9 years
86 (17.2)
66 (25.1)
20 (8.4)
Marital status
Married
372 (74.4)
234 (89)
138 (58.2)
c
2
(1 df)
=
61.87;
p
<
0.001
Not married
128 (25.6)
29 (11)
99 (41.8)
Doctor visits in previous year
0
240 (48)
141 (53.6)
99 (41.8)
c
2
(1 df)
=
7.00;
p
<
0.01
≥
1
260 (52)
122 (46.4)
138 (58.2)
BMI (kg/m
2
)
<
25
231 (46.2)
149 (56.7)
82 (34.6)
c
2
(1 df)
=
24.40;
p
<
0.001
≥
25
269 (53.8)
114 (43.3)
155 (65.4)
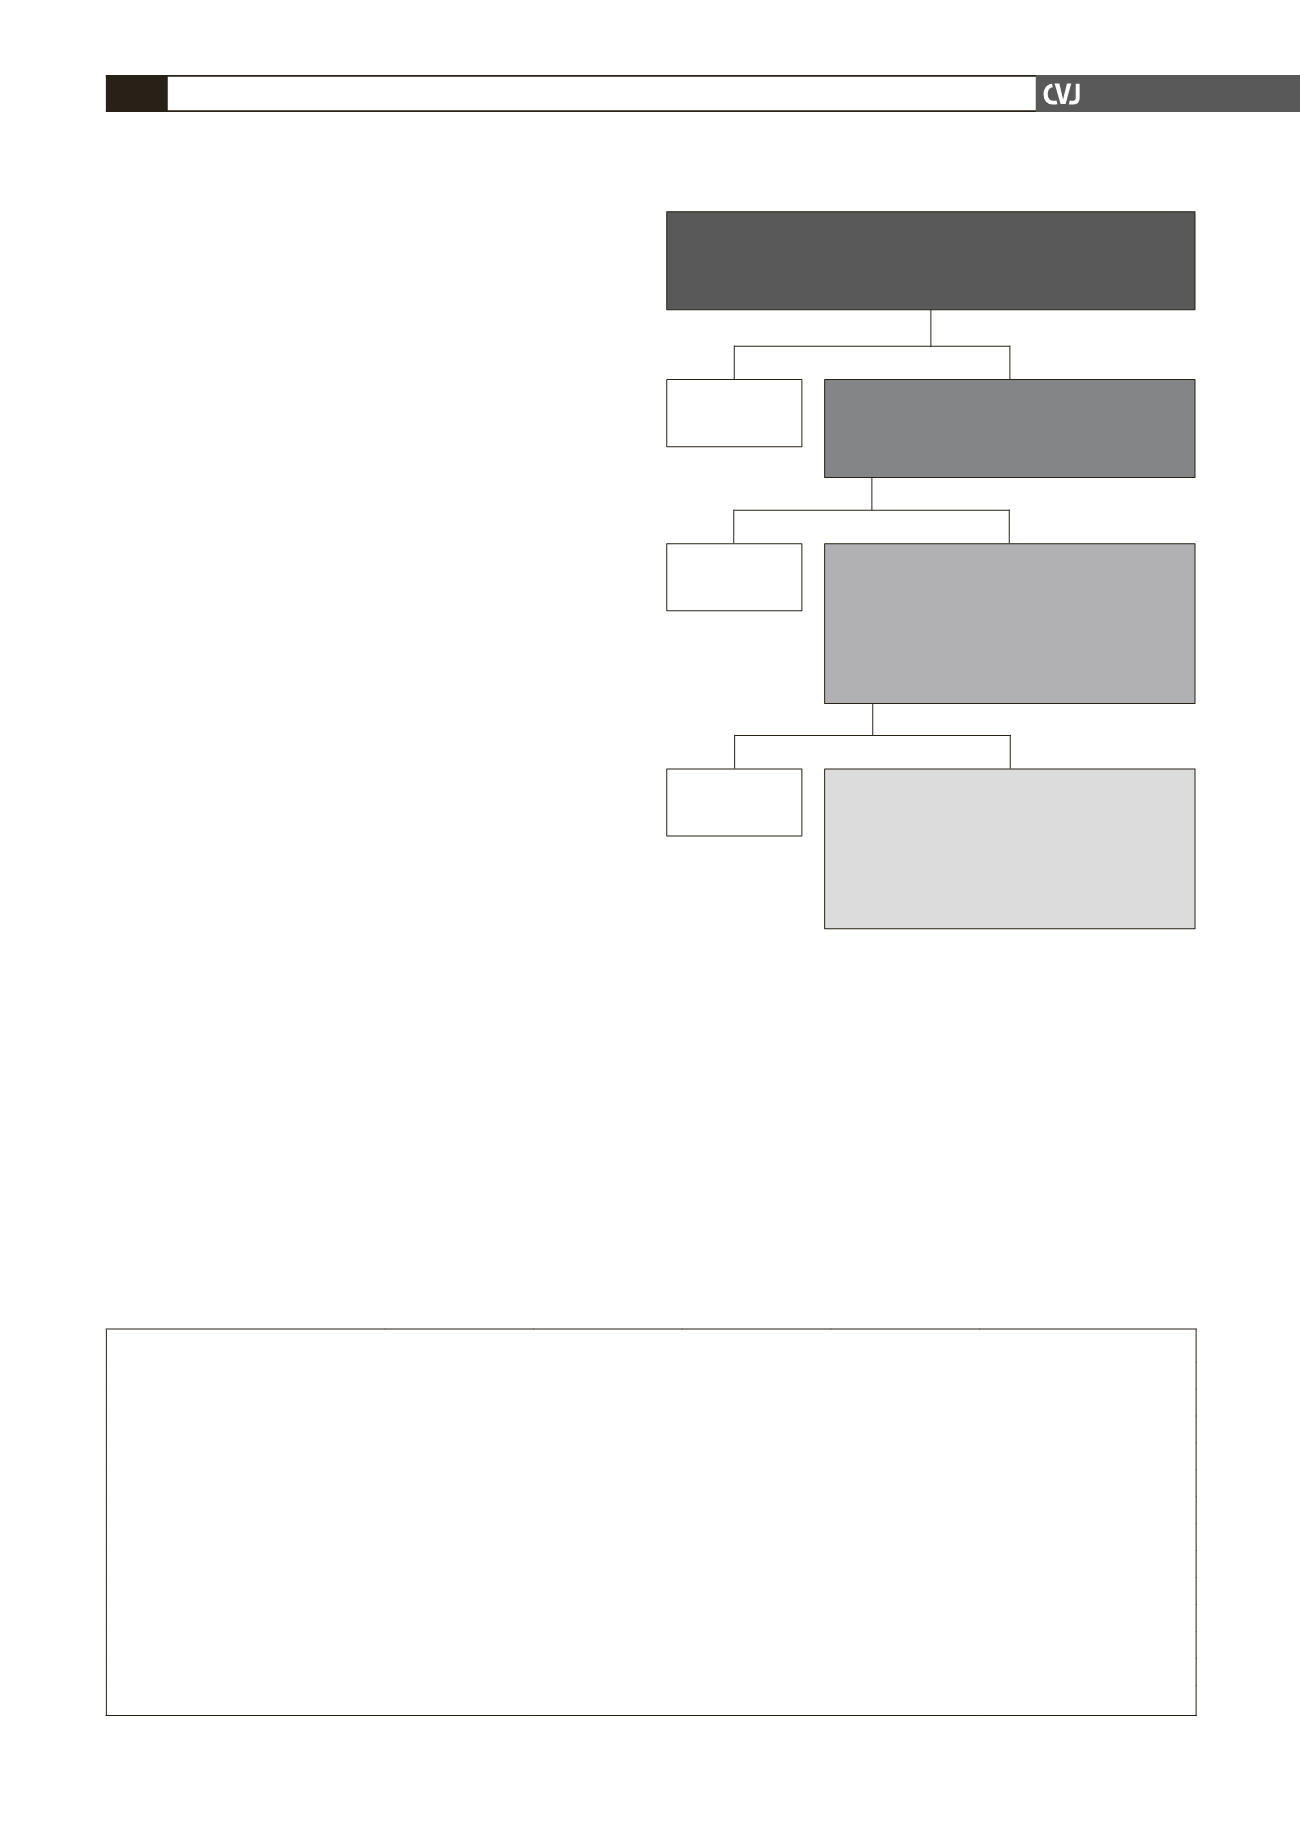
*The numbers of older Dakarites aware of their hypertension, treated
and controlled were obtained by multiplying the prevalence figure by the
population aged 50 years and older, according to the last census (2002).
Hypertensive
65.4% (95% CI: 61.5–69.3)
≈ 52 700 Dakarites aged 50 years and older*
Fig. 1. Prevalence, awareness, treatment and control of
hypertension in the population of Dakar aged 50 years
and older.
Aware
49.5% (95% CI: 44.1–54.9)
≈ 26 100 Dakarites aged 50 years and older*
Not aware
50.5%
Treated
70.6% (95% CI: 63.8–77.4)
among the aware
37.0% (95% CI: 31.8–42.2)
among the hypertensive
≈ 19 500 Dakarites aged 50 years and older*
Not treated
29.4%
Controlled
17.4% (95% CI: 10.4–24.4)
among the treated
6.7% (95% CI: 4.0–9.4)
among the hypertensive
≈ 3 500 Dakarites aged 50 years and older*
Not controlled
82.6%


