
CARDIOVASCULAR JOURNAL OF AFRICA • Volume 26, No 6, November/December 2015
AFRICA
223
xylasine (Rompun, Bayer) at a dose of 20 mg/kg via an
intraperitoneal line. Maintenance of anaesthesia was provided
with ketamine hydrochloride (50 mg/kg).
Three different agents were used for the three separate study
groups before I/R, as follows. Group I (
n
=
5): acetylsalicylic acid
(Coraspin
®
, Bayer, Leverkusen, Germany) was administered
orally via gavage at a dose of 30 mg/kg/day, beginning one week
prior to the start of the study. I/R was induced after one week of
medication administration. Group II (
n
=
5): clopidogrel bisulfate
(Planor
®
, Koçak Farma, Tekirda
ğ
, Turkey) was administered
orally via gavage at a dose of 1 mg/kg/day, beginning one week
prior to the start of the study. I/R was induced after one week
of drug administration. Group III (
n
=
5): ginsenoside Rb
1
(Panax
®
, Bayer, Leverkusen, Germany) was administered orally
via gavage at a dose of 100 mg/kg/day, beginning one week prior
to the start of the study. I/R was induced after one week of drug
administration.
Experimental I/R injury modelling
The right femoral arteries of all of the rats were explored with
simple femoral incision and the femoral artery was rounded
with a non-needle suture USP-3/0 metric silk (Dogsan Surgical
Sutures, Medical Material Industry Co. Inc, Trabzon, Turkey);
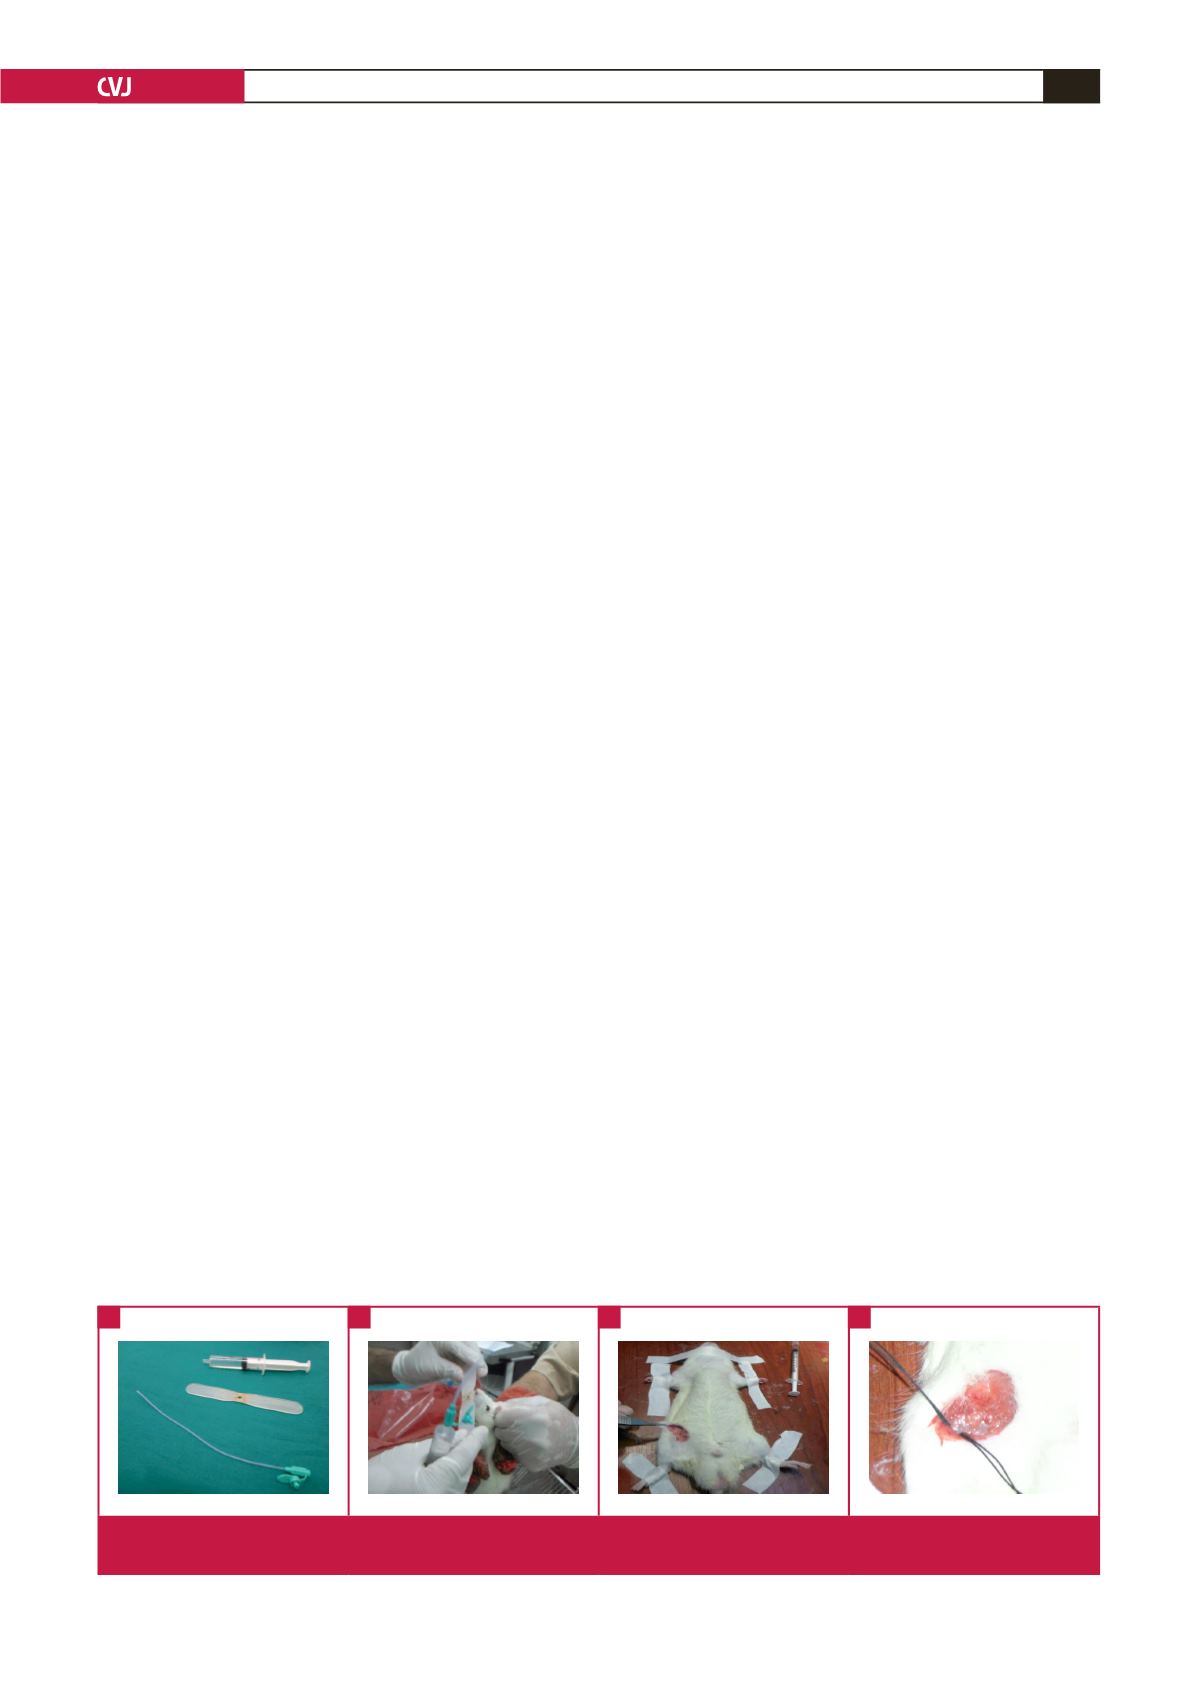
thereafter the femoral the artery was clamped for six hours (Fig.
1). The femoral clamp was removed to create reperfusion after
six hours. After reperfusion, all rats were sacrificed in the first
hour, and blood samples and cardiac and renal tissues were
obtained from each rat in each group.
All study protocols were designed according to previously
published protocols.
9
The drug utilisation and surgical protocols
are outlined in Fig. 1.
Laboratory analyses
NOx measurement: the Griess reagent method, which is based
on a modified cadmium reaction, was used to determine nitrogen
oxide (NOx) levels. This method measures platelet-derived nitric
oxide as described by Yavuz
et al.
10
NOx levels were calculated as
μ
M/g protein for tissue extracts and as
μ
mol/l for blood samples.
MDA measurement: malondialdehyde (MDA) levels were
evaluated according to the method described by Ohkawa
et al
.,
which is based on the determination of the levels of thiobarbituric
acid reactive products.
11
MDA values were expressed as
μ
M/g
protein for tissue extracts and as
μ
mol/l for blood samples.
PON1 measurement: the spectrophotometric modified
Eckerson method was used for the detection of paraoxonase 1
(PON1) activity.
12
The activity of PON1 was expressed as U/g
protein for tissue extracts and as U/l for blood samples.
Prolidase measurement: prolin (expressed as U/l protein for
tissue extracts and as U/g for blood samples), which is produced
by prolidase, was measured spectrophotometrically according to
the method described by Myara
et al
.
13
Statistical analysis
Oxidative markers in each group were analysed with SPSS
software version 15.0 (SPSS Inc., Chicago, IL), and
p
<
0.05 was
considered to be statistically significant. Obtained values were
presented as mean
±
standard deviation (SD). The Kolmogorov–
Smirnov test was used to assess the normality of the distributions.
Differences in the mean values between groups were assessed
with a one-way analysis of variance (ANOVA) test and a Tukey
HSD was used as a
post hoc
test;
p
<
0.05 was considered to be
statistically significant.
Results
In the control group, NOx levels were 8.99
±
5.01
μ
mol/l, 25.36
±
3.69
μ
M/g protein, and 14.06
±
4.12
μ
M/g protein for blood,
cardiac and renal samples, respectively. The control group’s
MDA values were 24.63
±
3.23
μ
mol/l, 28.38
±
4.87
μ
M/g
protein, and 13.11
±
3.90
μ
M/g protein for blood, cardiac and
renal samples, respectively. The activities of PON1 in the control
group’s blood, cardiac and renal samples were 256.55
±
19.06
U/l, 18.89
±
7.41 U/g protein, and 20.75
±
5.01 U/g protein,
respectively. The control group’s prolidase levels were 1283.52
±
545.44 U/l for blood samples, 63.47
±
11.51 U/g protein for
cardiac tissue extract, and 96.26
±
4.12 U/g protein for renal
tissue extract.
There were no significant differences between the groups in
terms of NOx levels. The comparison of NOx values between
the groups is presented in Fig. 2.
The PON1 activity in the blood from each drug group was
significantly different from that of the control group [control
vs group I (acetylsalicylic acid), (
p
<
0.05); control vs group II
(clopidogrel), (
p
<
0.05); control vs group III (ginsenoside), (
p
<
0.05)]. There was a significant difference (
p
<
0.05) between
the control group and group III (ginsenoside) in terms of
blood MDA levels. However, blood MDA levels of group II
(clopidogrel) were significantly lower than those of the controls
(
p
=
0.045). There were no significant differences between the
control group and any of the study groups in terms of cardiac
oxidative markers (
p
>
0.05).
Fig. 1.
A. Gavage set (injector, mouth brace, gavage catheter); B. gavage application; C. femoral incision; D. exploration of femoral
artery and rounding of vascular structure with non-needled silk sutures.
A
B
C
D


