
CARDIOVASCULAR JOURNAL OF AFRICA • Volume 26, No 6, November/December 2015
224
AFRICA
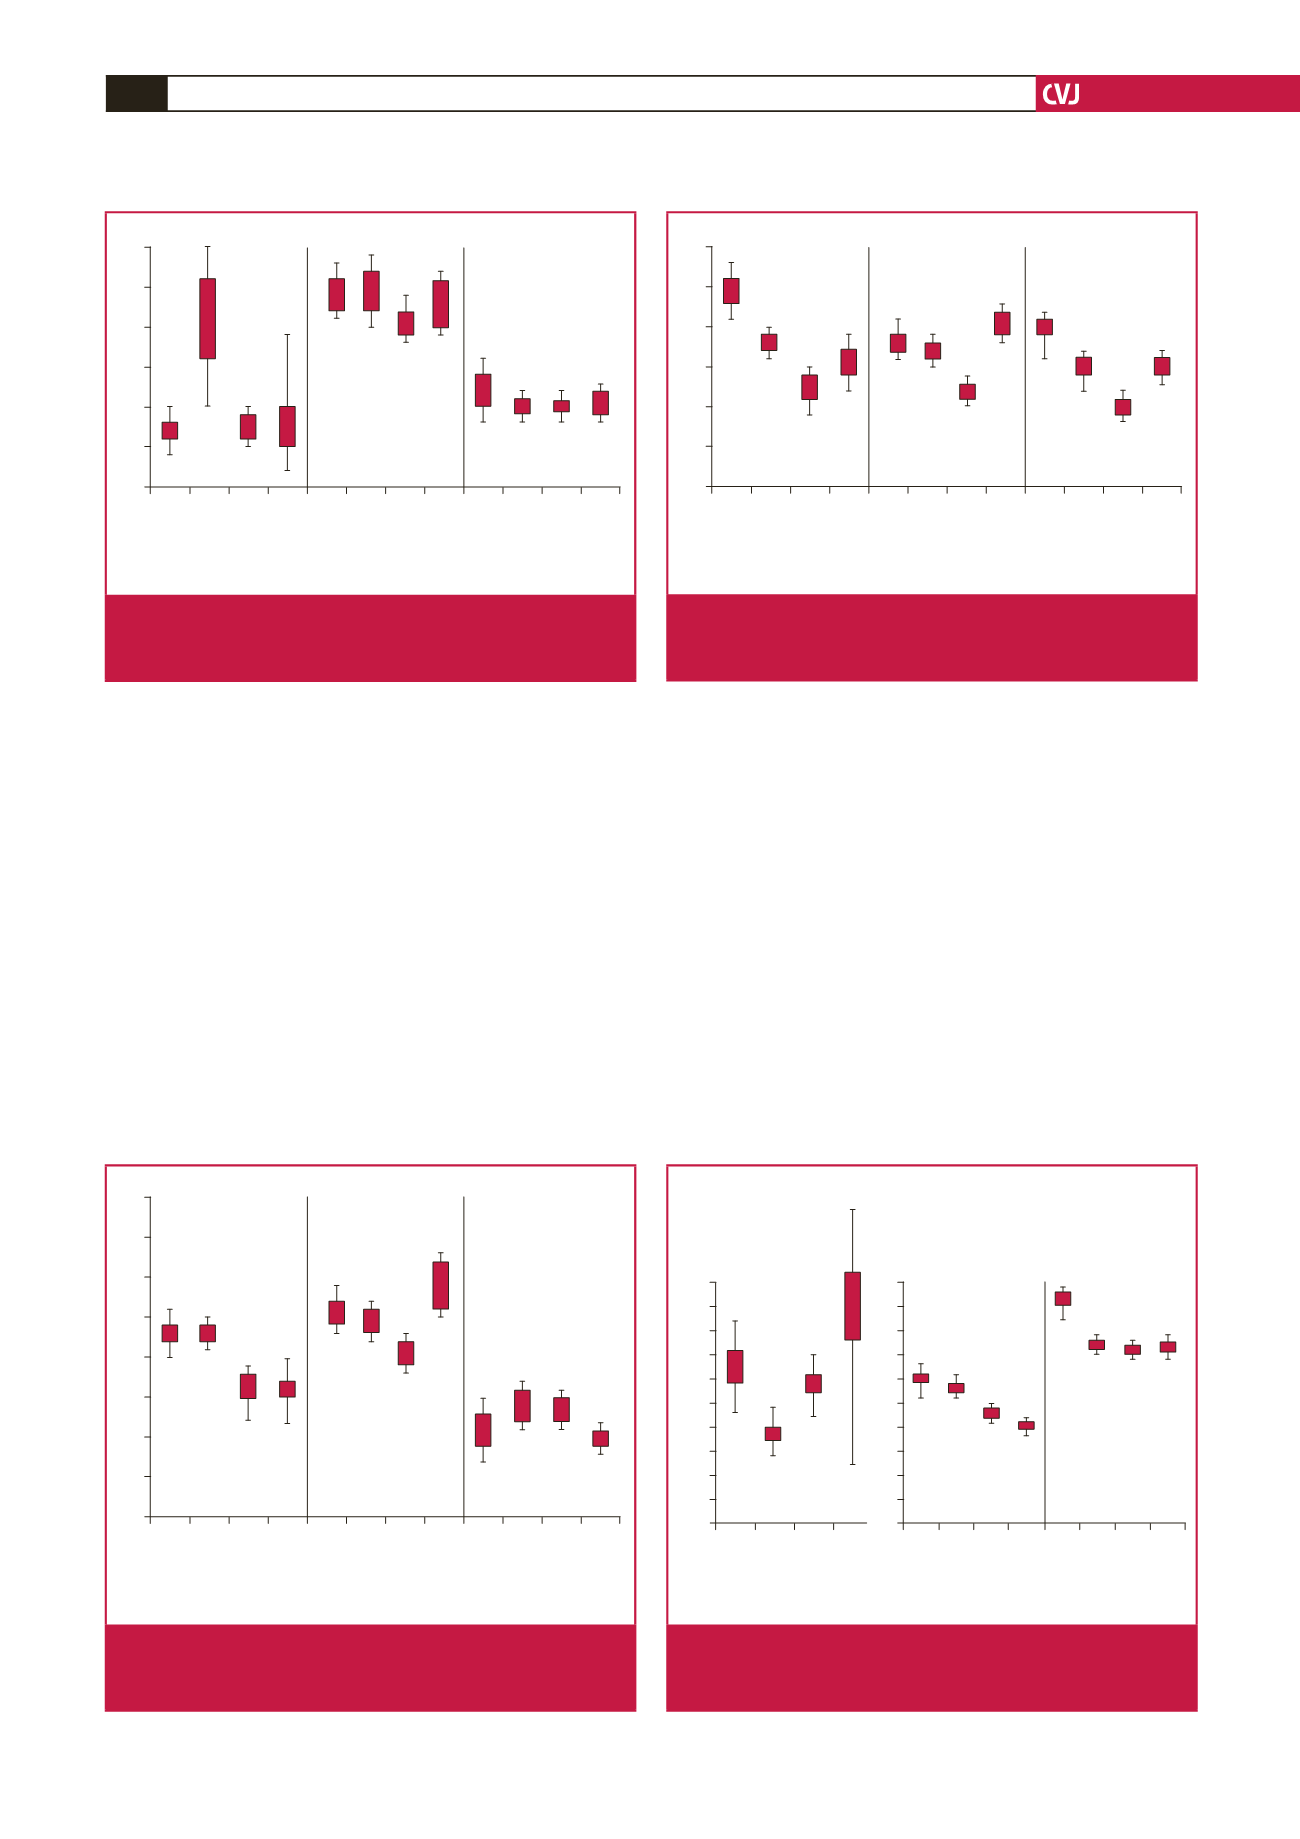
The MDA levels in each group are compared in Fig. 3.
Both renal prolidase and PON1 levels were significantly lower
in group II (clopidogrel) than in the control group (
p
<
0.05).
Similarly, renal prolidase levels were also markedly lower in
group III (ginsenoside,
p
<
0.05). The PON1 activities of each
group are presented in Fig. 4.
Renal prolidase levels were significantly lower in group I
(acetylsalicylic acid) than in the control group (
p
<
0.05). In
addition, cardiac prolidase levels were significantly lower in
groups II (clopidogrel) and III (ginsenoside) (
p
<
0.05). Prolidase
levels are compared between groups in Fig. 5.
Discussion
Our results suggest that experimental I/R induced oxidative
markers in blood, cardiac and renal samples. NOx values were
similar in both the study and control groups. Blood MDA values
were markedly lower in the clopidogrel and ginsenoside groups
when compared with the control group. Decreased PON-1
levels were found in the clopidogrel group when compared with
other groups. Significantly decreased cardiac prolidase levels
were detected in the clopidogrel and ginsenoside groups when
compared with the control group. Renal prolidase levels were
markedly decreased in all study groups that were treated with
acetylsalicylic acid, clopidogrel or ginsenoside.
For centuries, herbal products have been widely used to
treat or alleviate the symptoms of many diseases. Moreover,
some of these herbs are currently used for traditional disease
management.
14,15
According to the World Health Organisation
(WHO) report, it is estimated that more than 80% of the world’s
population is dependent on herbal medicine.
14
Most believe that
it is safe to use these natural products, although side effects,
toxicity and adverse drug interactions have been reported.
C I
II
III
C I
II
III
C I
II
III
Blood
μ
mol/l
Cardiac
μ
M/g protein Renal
μ
M/g protein
NOx levels
30
25
20
15
10
5
0
8.99
±
5.01
26.87
±
17.65
9.41
±
4.89
11.75
±
13.36
14.06
±
4.12
12.53
±
1.90
12.03
±
1.12
25.36
±
3.69
22.58
±
3.99
25.24
±
2.16
25.36
±
3.69
12.92
±
2.82
p
=
0.091
p
=
0.917
p
=
0.838
p
=
0.402
p
=
0.459
p
=
0.937
p
=
0.297
p
=
0.437
p
=
0.640
Fig. 2.
Comparison of blood, renal and cardiac nitrogen oxide
(NOx) levels in each group. C: control group; I: group I;
II: group II; III: group III.
C I
II
III
C I
II
III
C I
II
III
Blood
μ
mol/l
Cardiac
μ
M/g protein Renal
μ
M/g protein
MDA levels
40
35
30
25
20
15
10
5
0
24.63
±
3.23
24.12
±
2.39
17.03
±
5.37
16.36
±
5.89
13.11
±
3.90
17.48
±
2.53
16.33
±
1.88
26.26
±
3.76
22.81
±
2.89
33.73
±
2.52
23.38
±
4.87
11.33
±
2.61
p
=
0.940
*p
=
0.045
p
=
0.043
p
=
0.286
p
=
0.224
p
=
0.403
p
=
0.084
p
=
0.078
p
=
0.459
Fig. 3.
Comparison of blood, renal and cardiac malondialde-
hyde (MDA) levels in each group. C: control group; I:
group I; II: group II; III: group III.
C I
II
III
C I
II
III
C I
II
III
Blood U/l
Cardiac U/g protein Renal U/g protein
PON1 levels
30
25
20
15
10
5
0
256.55
±
19.06
176.92
±
28.58
140.05
±
38.56
166.72
±
34.43
20.75
±
5.01
17.25
±
3.10
18.65
±
0.73
16.91
±
1.57
11.19
±
1.11
21.91
±
8.35
18.89
±
7.41
11.45
±
2.34
*p
=
0.004
*p
=
0.000
*p
=
0.001
p
=
0.513
p
=
0.441
p
=
0.654
p
=
0.069
p
=
0.725
*p
=
0.026
Fig. 4.
Comparison of blood, renal and cardiac paraoxonase
1 (PON1) activity in each group. C: control group; I:
group I; II: group II; III: group III.
C I
II III C I
II III
Blood U/l
Cardiac U/g protein Renal U/g protein
Prolidase levels
1500
1400
1300
1200
1100
1000
800
600
400
200
0
100
90
80
70
60
50
40
30
20
10
0
1283.52
±
545.44
848.75
±
255.46
1167.32
±
371.32
1557.32
±
1230.56
96.26
±
4.12
76.48
±
4.77 75.85
±
3.47
55.77
±
5.02
45.72
±
2.93
42.44
±
3.65
63.47
±
11.51
75.16
±
5.53
p
=
0.177
p
=
0.720
p
=
0.670
*p
=
0.000
*p
=
0.000
p
=
0.179
*p
=
0.016
*p
=
0.012
*p
=
0.000
C I
II
III
Fig. 5.
Comparison of blood, renal and cardiac prolidase
activity in each group. C: control group; I: group I; II:
group II; III: group III.


