


 13 / 76

CARDIOVASCULAR JOURNAL OF AFRICA • Volume 29, No 3, May/June 2018
AFRICA
143
of AF in patients hospitalised for AHF. Significantly, this study
describes an important sub-population of patients with AF,
namely AF due to valvular (mostly rheumatic) heart disease,
which is still relatively prevalent in sub-Saharan Africa.
17-21
The prevalence of AF was 21%, which is generally lower
than that reported in previous studies, ranging between 23 and
41%.
22-25
Among acutely decompensated HF patients, 20 to 35%
will be in AF at presentation.
26
This difference may be due to the
fact that in sub-Saharan Africa, patients with AHF are younger
and have less incidence of ischaemic heart disease. Indeed in the
Heart of Soweto HF cohort, AF occurred in only 6.6% of all
2 393 HF cases within the entire study cohort.
17
This however
was not in the acute decompensated HF setting.
RHDwas the thirdcommonest causeof HF in theTHESUS-HF
study after hypertension and idiopathic dilated cardiomyopathy.
2
Almost half of all those with AF in this study had valvular disease
compared to 23% in those without AF. Valvular heart disease has
long been associated with the development of AF. Population-
based estimates from the Framingham data revealed that valvular
disease was associated with a 1.8-fold increase of risk of AF in
men and a 3.4-fold increased risk in women.
27
Although any valvular pathology can be related to AF,
stenotic left-sided valvular lesions (and in particular RHD) have
the highest prevalence rates. Severity of the obstruction follows
a dose–response relationship: prevalence of AF was 9.1% in
patients with mild-to-moderate aortic stenosis and 33.7% among
those with severe stenosis.
28,29
Likewise, the prevalence of AF
varies with the complexity of RHD: from 16% with isolated
mitral regurgitation to 29% with isolated mitral stenosis, to 52%
with coexisting mitral regurgitation and stenosis, and to 70%
with mixed mitral and tricuspid valve disease.
30
We found low rates of anticoagulation in this cohort. In a
prospective study of AF patients in Cameroon, only 34% of
patients with an indication for oral anticoagulation received
it;
31
similar to the 33% of patients with AF who received
warfarin in the Heart of Soweto study.
17
In this study 52%
of our patients with AF received oral anticoagulants. By
contrast, a much higher percentage of patients received an
anticoagulant in Senegal, where in a retrospective hospital-based
study, anticoagulation with warfarin was established in 62%
of cases.
32
In the REMEDY registry,
18
40.7% of patients had
indications for oral anticoagulants and they were prescribed in
69.5% of patients. The use of oral anticoagulants was high in
patients with mechanical heart valves (91.6%) and AF (68.6%),
but low in those with mitral stenosis in sinus rhythm with either
dilated left atrium or left atrial thrombus (20.3%).
A study at a private urban referral teaching hospital in
Nairobi, Kenya, found that 80% of patients with AF and a
CHADS2 score of 2 received anticoagulation.
33
Similarly, a
recent observational multicentre national registry in South
Africa indicated that 75% of patients with AF were on warfarin
for stroke prevention.
34
We did not collect data on the quality of
anticoagulation control in this study.
The presence of AF was not associated with all-cause death
or readmission within 60 days, but having valvular AF predicted
Table 5. Associations of valvular and non-valvular atrial fibrillation
with all-cause death within 180 days
Variable
HR for a
change of
Unadjusted hazard
ratio
Multivariable adjusted
hazard ratio
(95% CI
1
)
p
-value (95% CI
1
)
p
-value
Valvular atrial
fibrillation
Yes vs no
1.61
(1.00–2.58) 0.0475
1.61
(0.99–2.62)
0.0563
Non-valvular
atrial fibrillation
Yes vs no
0.69
(0.39–1.21) 0.1949
0.70
(0.39–1.26)
0.2331
Male gender
Yes vs no
–
–
1.36
(0.96–1.92)
0.0859
Haemoglobin
(g/dl)
1 unit
increase
–
–
0.93
(0.87–1.00)
0.0551
HIV positive
Yes vs no
–
–
1.82
(1.08–3.06)
0.0239
Current or
former smoker
Yes vs no
–
–
0.49
(0.24–0.99)
0.0479
Malignancy
Yes vs no
–
–
3.05
(1.24–7.54)
0.0157
Hx of cor
pulmonale
Yes vs no
–
–
2.04
(1.26–3.30)
0.0038
SBP (mmHg)
10 units
increase
–
–
0.85
(0.80–0.90)
< 0.0001
Orthopnoea
(2/3 vs 0/1)
–
–
2.32
(1.06–5.10)
0.0360
Peripheral
oedema
(2/3 vs 0/1)
–
–
1.76
(1.15–2.69)
0.0094
Rales
(2/3 vs 0/1)
–
–
1.71
(1.11–2.63)
0.0155
Creatinine
(mg/dl)
2
1.55 vs 0.90
–
–
1.37
(1.06–1.77)
0.0239
1
Hazard
ratio
from Cox
regression model.
2
Appropriate
transformation used due
to
the non-linear
relationship between
predictor and outcome.
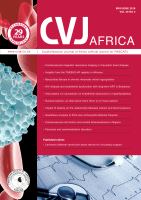
Study day
0
10
20
30
40
50
60
Survival probability
1.00
0.95
0.90
0.85
0.80
0.75
0.70
0.65
Log-rank
p
-value vs no AF:
Valvular AF: 0.24
Non-valvular AF: 0.96
No AF
Valvular AF
Non-valvular AF
Fig. 1.
Kaplan–Meir plot: death or rehospitalisation up to day
60 based on presence and type of AF.
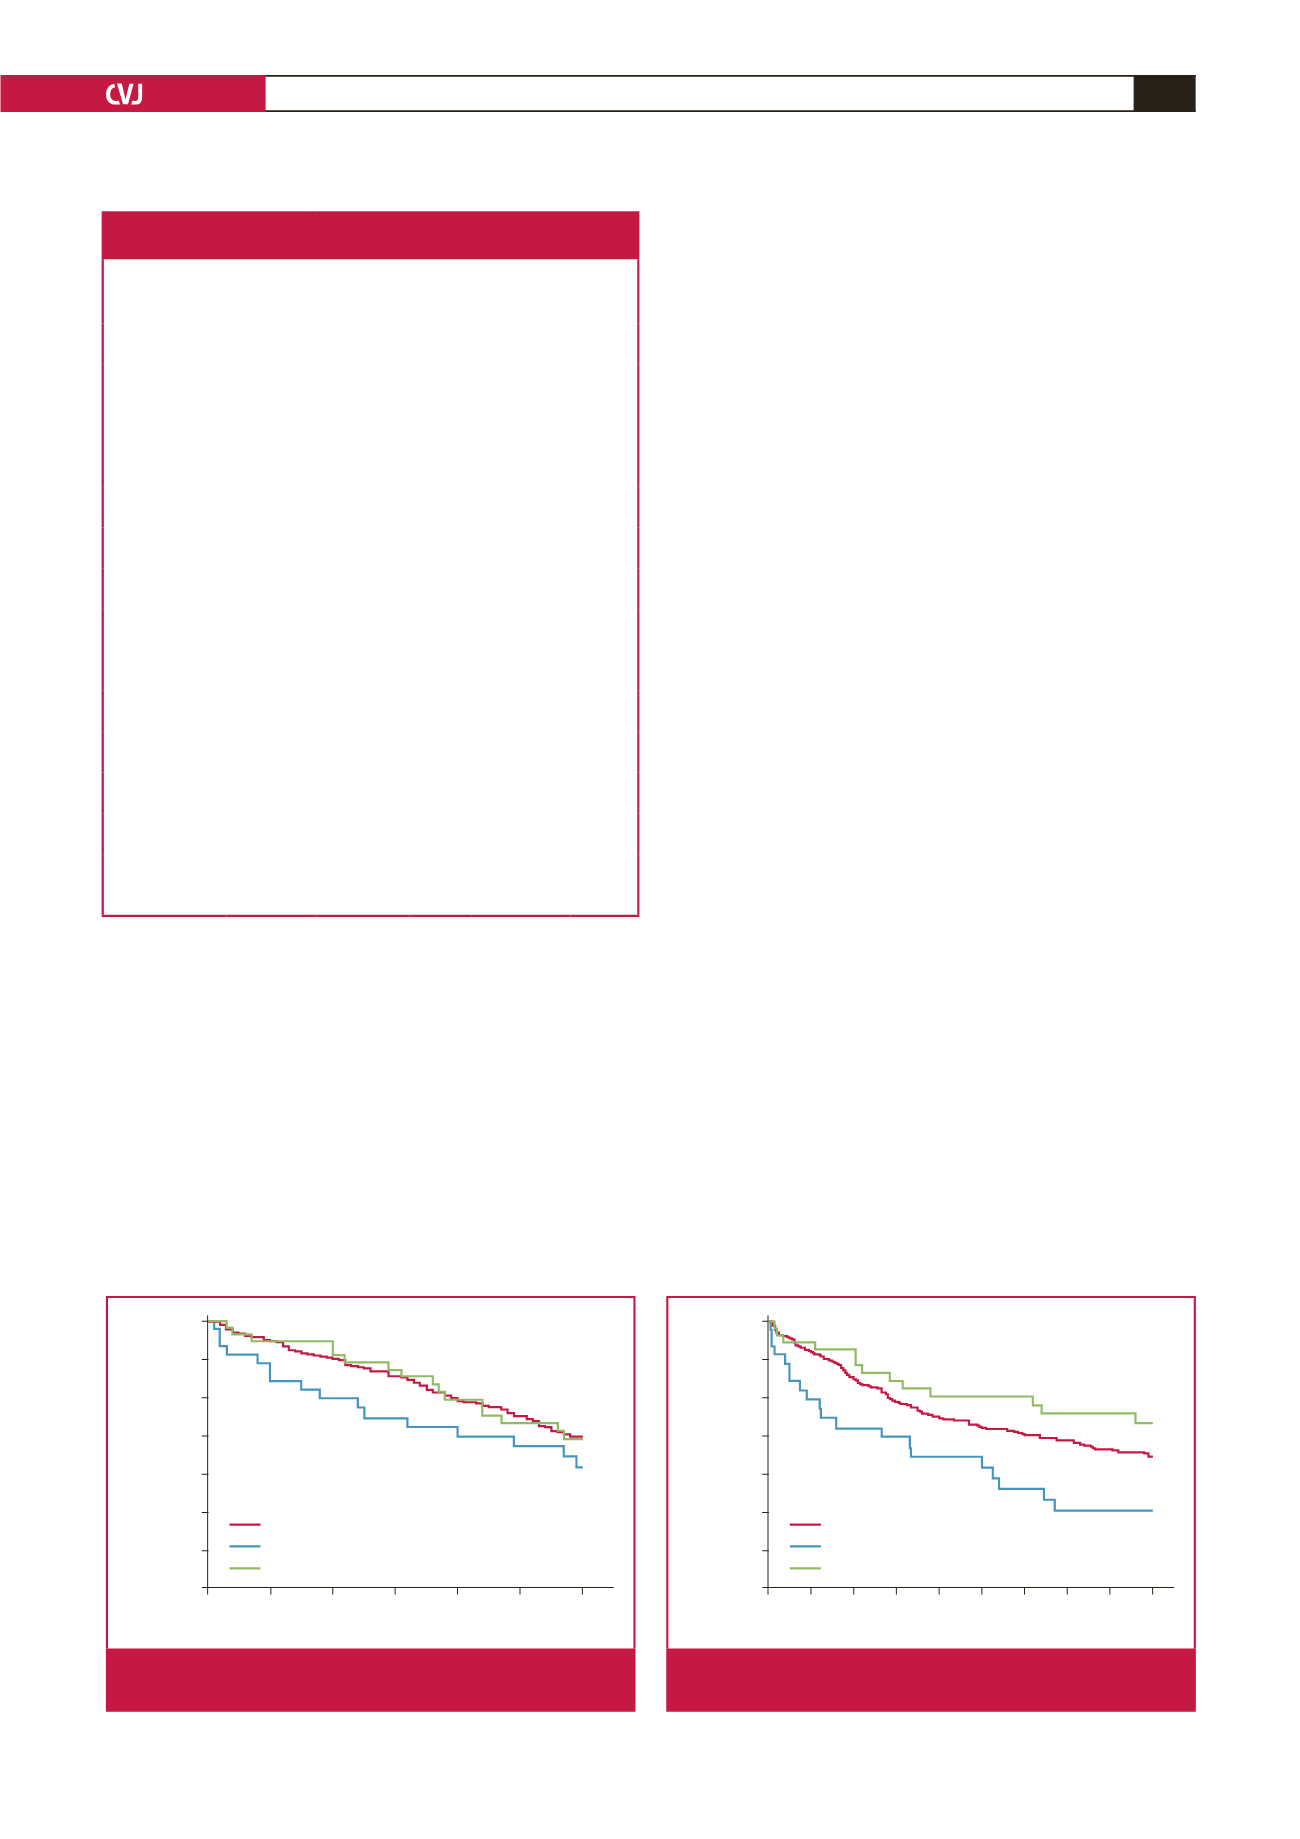
Study day
0 20 40 60 80 100 120 140 160 180
Survival probability
1.00
0.95
0.90
0.85
0.80
0.75
0.70
0.65
Log-rank
p
-value vs no AF:
Valvular AF: 0.06
Non-valvular AF: 0.23
No AF
Valvular AF
Non-valvular AF
Fig. 2.
Kaplan–Meir plot: death up to day 180 based on pres-
ence and type of AF.