


 17 / 76

CARDIOVASCULAR JOURNAL OF AFRICA • Volume 29, No 3, May/June 2018
AFRICA
147
mmHg), pre-hypertensive (120
≤
SBP
<
140 mmHg or 80
<
DBP
≤
89 mmHg) and hypertensive (SBP
≥
140 and DBP > 90 mmHg).
14
The level of VF was measured using InnerScan body
composition monitors (Tanita, Japan). BMI was calculated by
dividing measured body weight by the square of height (kg/
m
2
). Height and waist circumference (WC) were measured in the
standing position using a stadiometer (THP-DA, Japan) and
measuring tape, respectively.
The CardioChek
®
PA cholesterol test system was used to
determine total cholesterol (TC), low-density lipoprotein (LDL)
cholesterol, high-density lipoprotein (HDL) cholesterol and
triglyceride (TG) levels. This device was approved by the United
States Food and Drug Administration and Cholesterol Reference
Method Laboratory Network.
SBP and DBP from the left brachial artery were measured
in the seated position using an automatic BP monitor (Tango,
SunTech Medical, USA). Mean blood pressure (MBP) was
calculated from DBP
+
(SBP – DBP)/3.
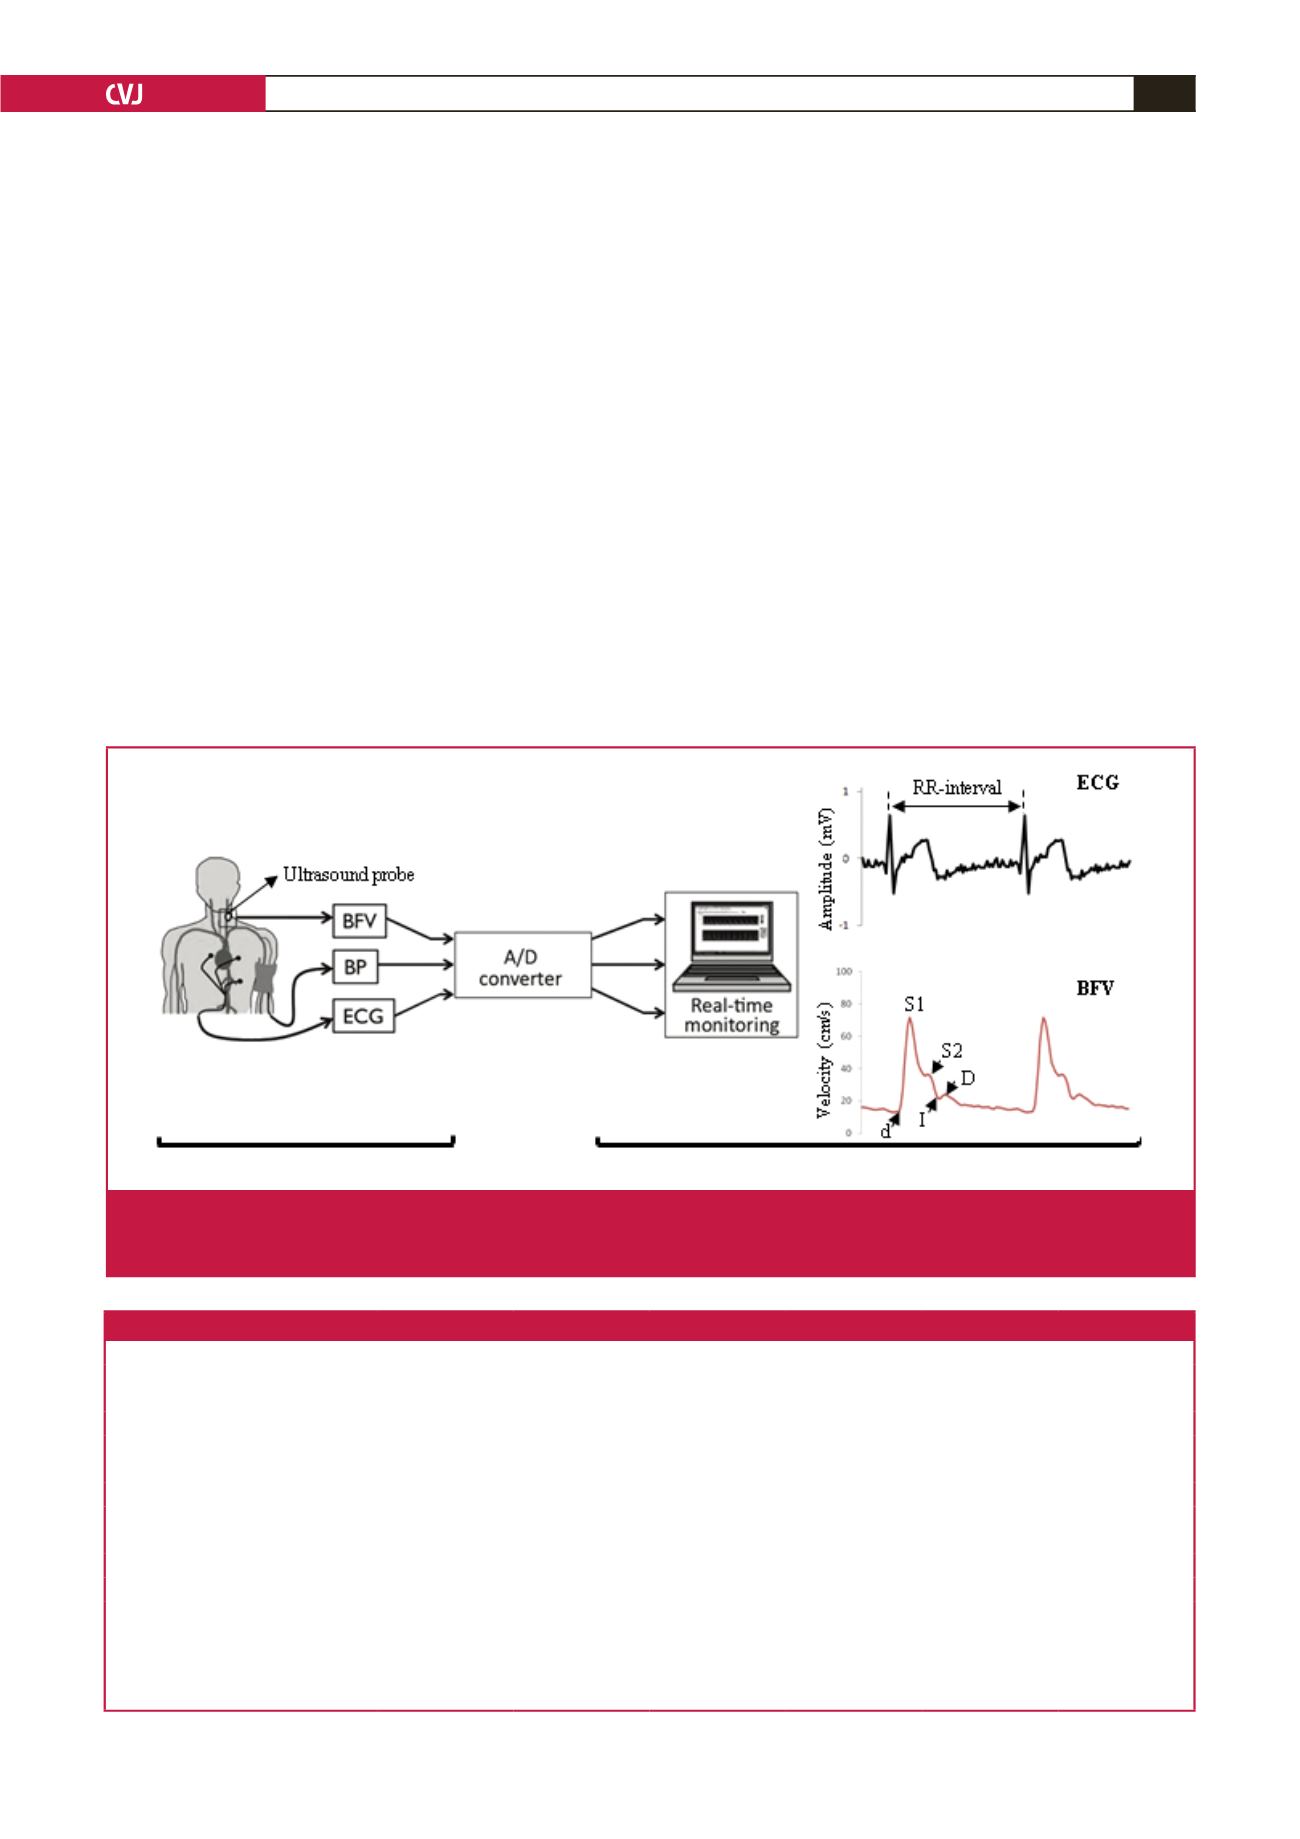
The BFV measurement system was based on an application
of the Doppler ultrasound technique. The portable system
consisted of a probe, a Doppler signal discriminator (DSD),
a transmitter at the main unit, a receiver, an analog–digital
converter (A/D converter) and a computer for real-time
monitoring and analysis.
15
BFV was measured simultaneously
with electrocardiogram (ECG) and BP as illustrated in Fig. 1.
Measurements of ECG and BP were used as reference data.
The flow velocity (V
d
) was determined from the Doppler-shift
frequency (f
d
):
V
d
=
c
f
d
_______
(2f
0
cos
θ
)
where
c
=
1 540 m/s, the speed of acoustic waves in human tissue,
f
0
=
2.0 MHz, an irradiated ultrasound frequency, and
θ
is the
Doppler insonation angle at 50 degrees.
From the Doppler shift frequency of reflected signals,
low-frequency signals and harmonic noise were filtered by a
band-pass filter of 0.1 to 5.0 kHz that was installed in the DSD.
From the same range of frequency, BFV could be extracted.
Signal data were transmitted to the receiver at a transmission
rate of 28.8 kbps and an output of ~0.5 mV/m. The data were
converted into a digital signal with a sampling frequency of
Synchronised measurement system
Real-time monitor and analysis
Fig. 1.
Blood flow velocity (BFV) measurement system, synchronised with electrocardiogram (ECG) and blood pressure (BP), using
real-time monitoring (left). Feature points on waveform: S1: peak systolic (maximum velocity), S2: second systolic, I: incisura
between systole and diastole, D: peak diastolic, and d: end-diastolic velocities (right).
Table 1. Subjects’ characteristics for each visceral fat and blood pressure category in the cross-sectional study
Variable
Lower VF
Middle VF
Higher VF
Normotensive
Pre-hypertensive
Hypertensive
Age (years)
28
±
1
32
±
2
49
±
2
‡§
27
±
1
35
±
2*
50
±
3*
†
Body mass data
Height (cm)
161.9
±
1.1
164.2
±
1.3
169.5
±
1.1
‡§
162.9
±
1.2
164.9
±
1.1
166.5
±
2.1
Weight (kg)
51.2
±
0.8
60.0
±
0.9
‡
64.9
±
1.2
‡§
53.6
±
0.9
58.0
±
1.2*
62.9
±
2.3*
BMI (kg/m²)
19.5
±
0.2
22.2
±
0.2
‡
22.6
±
0.2
‡
20.2
±
0.3
21.2
±
0.2*
22.6
±
0.4*
†
WC (cm)
69.7
±
0.6
77.2
±
0.6
‡
82.2
±
0.9
‡§
71.4
±
0.7
75.7
±
0.9*
81.8
±
1.6*
†
Metabolic variables (mg/dl)
Glucose (mmol/l)
77.1
±
1.9
78.5
±
2.9
89.9
±
3.6
‡§
77.8
±
2.1
80.3
±
2.2
91.9
±
5.8*
†
TC (mmol/l)
195.4
±
7.5
189.5
±
7.0
205.8
±
9.6
187.4
±
6.5
206.9
±
8.5
195.9
±
8.9
HDL (mmol/l)
78.4
±
3.6
80.1
±
9.3
53.9
±
2.9
‡§
75.7
±
3.8
72.0
±
6.5
59.8
±
5.5
TG (mmol/l)
62.6
±
4.8
79.8
±
6.3
123.9
±
15.3
‡§
63.7
±
5.9
98.5
±
10.6*
102.7
±
18.9
LDL (mmol/l)
101.0
±
4.9
95.0
±
11.9
117.5
±
6.1
100.3
±
5.2
103.8
±
9.2
115.6
±
9.2
The data are presented as mean and SEM. Tukey significances: *
p
<
0.05 versus normotensive,
†
p
<
0.05 versus pre-hypertensive,
‡
p
<
0.05 versus lower VF and
§
p
<
0.05
versus middle VF. VF: visceral fat, BP: blood pressure; BMI: body mass index; TC: total cholesterol; HDL: high-density lipoprotein cholesterol; TG: triglycerides; LDL:
low-density lipoprotein cholesterol.