


 44 / 76

CARDIOVASCULAR JOURNAL OF AFRICA • Volume 29, No 3, May/June 2018
174
AFRICA
significant relationship between 24-hour sodium excretion rate
and BP in the total sample but when participants were stratified
according to BMI status, the relationship reached statistical
significance in the normal-weight individuals, even though it
remained insignificant in the overweight/obese participants.
When participants were divided according to gender, there was
a significant association between urinary sodium excretion rate
and BP in the total sample of men and in the normal-weight men
but not in overweight men. In women there was no relationship
between 24-hour urine excretion and BP, irrespective of BMI
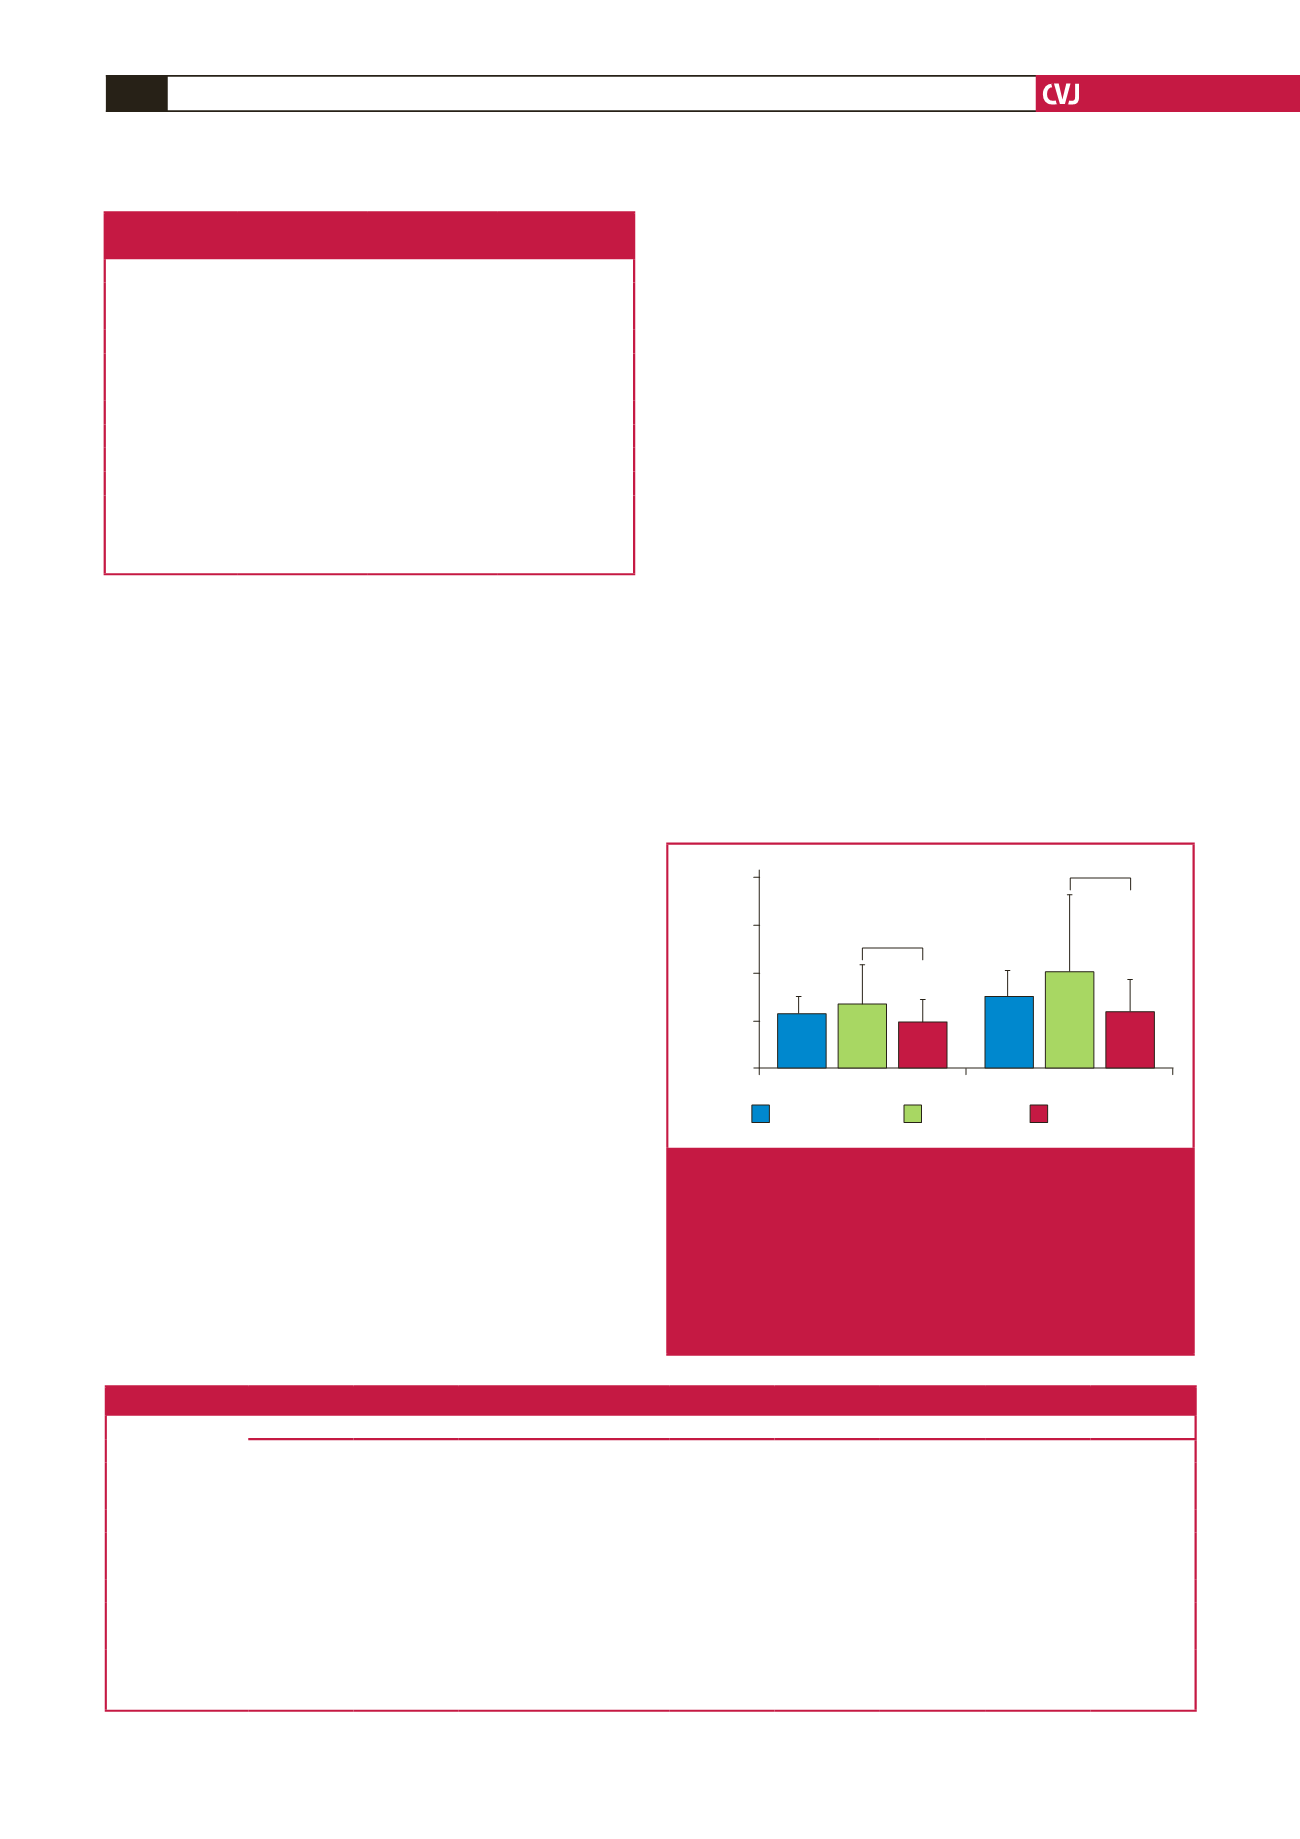
status. Fig. 1 compares the slopes of the relationship between
24-hour urinary sodium excretion and BP in the total population.
The slope (
β
-coefficient) of the normal-BMI participants was
significantly higher than that of the overweight/obese group.
Discussion
To determine the masking effects of an increased BMI, we first
investigated the relationship between 24-hour urinary sodium
excretion and BP in the total population sample. Consistent with
previous studies in this population
4-6
and in other population
groups,
29,30
we found no relationship. In spite of the inconclusive
results in this population, the relationship between sodium level
and BP has been well established in a number of studies,
31-34
therefore our current findings require thorough scrutiny.
The limitations of previous studies conducted in this
population could be that they did not take into consideration
the high prevalence of obesity. So in order to account for the
high incidence of obesity, in this study we stratified participants
according to BMI status.
In a multivariate regression analysis, there was a statistically
significant relationship between 24-hour urinary sodium
excretion and both systolic and diastolic BP. However sodium
level was not related to BP in the overweight/obese group.
This difference was further demonstrated when the slopes of
this relationship were compared between the two groups. The
β
-coefficients of the normal-BMI participants were significantly
higher than those of the overweight/obese groups. This is
indicative of a stronger relationship in the normal-weight group
compared to the overweight/obese individuals.
The differences in the relationship between the two groups
are indicative of the masking effects of obesity. These masking
effects were further confirmed when the participants were
divided according to gender. In men, the relationship was present
in the total sample of men and in the lean group but not in the
overweight/obese group. In the women, no relationship was
observed irrespective of BMI status.
The gender differences are due to dissimilarities in the degree
of obesity in the two groups. In men the average BMI was 24.9
±
5.0 kg/m
2
and only 47% were overweight or obese. On the
other hand the average BMI in women was 31.5
±
8.1 kg/m
2
with
75% of the women in the overweight/obese category. Due to the
lower BMI and lower proportion of overweight/obese men, the
relationship between sodium and BP was not masked. On the
SBP24
DBPD
β
-Coefficient of urinary Na
+
(mmol/day) vs BP (mmHg)
4
3
2
1
0
*
*
Total population
Normal BMI
Overweight/obese
Fig. 1.
Multi-adjusted slopes (
β
-coefficients) of 24-hour urinary
sodium excretion versus 24-hour systolic and dias-
tolic blood pressure in the total sample, normal-weight
and overweight/obese participants. Adjustments were
made for age, gender, smoking, alcohol intake, diabe-
tes and hypertension. BMI, body mass index; BP,
blood pressure; SBP24, 24-hour systolic blood pres-
sure; DBP24, 24-hour systolic blood pressure.
Table 2. Haemodynamic characteristics of the
study population according to BMI status
All participants
Normal BMI
a
Overweight
b
/Obese
c
Total sample
SBP24 (mmHg)
118.6
±
14.9
114.9
±
12.3
121.6
±
16.1*
DBP24 (mmHg)
72.2
±
8.5
71.3
±
9.1
74.4
±
10.6*
Women
SBP24 (mmHg)
116.9
±
98.1
109.6
±
9.8
116.6
±
15.1*
DBP24 (mmHg)
71.9
±
9.9
68.4
±
7.3
71.3
±
9.9*
Men
SBP24 (mmHg)
123.2
±
18.1
119.8
±
12.15
125.4
±
15.7*
DBP24 (mmHg)
64.4
±
11.6
63.2
±
11.1
66.8
±
12.6*
BMI, body mass index; SBP24, 24-hour ambulatory systolic blood pressure;
DBP24, 24-hour ambulatory diastolic blood pressure.
a
Normal weight is defined as
<
25 kg/m
2
,
b
overweight is defined as BMI ≥ 25
<
30
kg/m
2
and
c
obese is defined as BMI ≥ 30 kg/m
2
. *
p
<
0.05 vs normal BMI.
Table 3. Relationship between dietary sodium intake and 24-hour ambulatory BP according to gender and BMI status
Total sample
Men
Women
All participants
Partial
r
2
95% CI
p-
value
Partial
r
2
95% CI
p-
value
Partial
r
2
95% CI
p-
value
SBP24 (mmHg)
0.08
–0.01–0.16
0.0872
0.23
0.02–0.40
0.0252*
0.05
–0.06–0.15
0.4095
DBP24 (mmHg)
0.06
0.02–0.14
0.1469
0.21
0.02–0.40
0.0299*
0.07
0.03–0.18
0.1747
Normal BMI
a
SBP24 (mmHg)
0.11
0.02–0.19
0.0146*
0.25
0.05–0.43
0.0122*
0.07
–0.14–0.29
0.5016
DBP24 (mmHg)
0.10
0.01–0.18
0.0193*
0.29
0.10–0.47
0.0030*
0.06
–0.14–0.29
0.5016
Overweight
b
/obese
c
SBP24 (mmHg)
0.06
–0.04–0.17
0.2448
0.01
–0.2–0.19
0.9091
0.08
–0.05–0.21
0.2058
DBP24 (mmHg)
0.07
–0.04–0.17
0.2551
0.01
–0.2–0.21
0.9751
0.09
–0.02–0.22
0.1281
CI, confidence intervals; SBP24, 24-hour systolic blood pressure; DBP24, 24-hour diastolic blood pressure; BMI, body mass index.
a
Normal BMI is defined as
<
25 kg/m
2
,
b
overweight is defined as BMI ≥ 25
<
30 kg/m
2
and
c
obese is defined as BMI ≥ 30 kg/m
2
.
Adjustments were made for age, gender (in the total population), BMI (as a continuous variable), hypertension, diabetes, smoking and alcohol intake.