


 40 / 74

CARDIOVASCULAR JOURNAL OF AFRICA • Volume 29, No 5, September/October 2018
302
AFRICA
Diet was measured using the 24-hour recall method, which is
a valid method to determine group dietary intake.
14
In December
2015, senior Northern Sotho-speaking dietetics students of
the University of Limpopo, specifically trained in using the
24-hour recall method, interviewed the parent/caregiver at
home regarding the dietary intake of the young adults over the
previous 24 hours. For each participant, an interview took place
on one weekday and one weekend day. An average of two days
of 24-hour dietary intake was then taken for each participant.
Estimated portion sizes of foods consumed were recorded in as
much detail as possible, using a pre-tested questionnaire and food
models simulating average portions of local foods.
15,16
Dietary data
were analysed using local food tables and Food Finder dietary
software, and compared with recommended intakes.
15-18
Statistical analysis
Variables were summarised as descriptive statistics. Linear
regression models were used to assess the continuous association
between dietary intake and BMI, while logistic regression models
were used to assess the association between low/high dietary
intake and prevalent overweight and obesity, both in invariable
analyses and after adjusting for age and gender. All data
were analysed using the statistical package for social sciences
(SPSS) version 23 and a
p
-value < 0.05 was used to characterise
statistically significant results.
Results
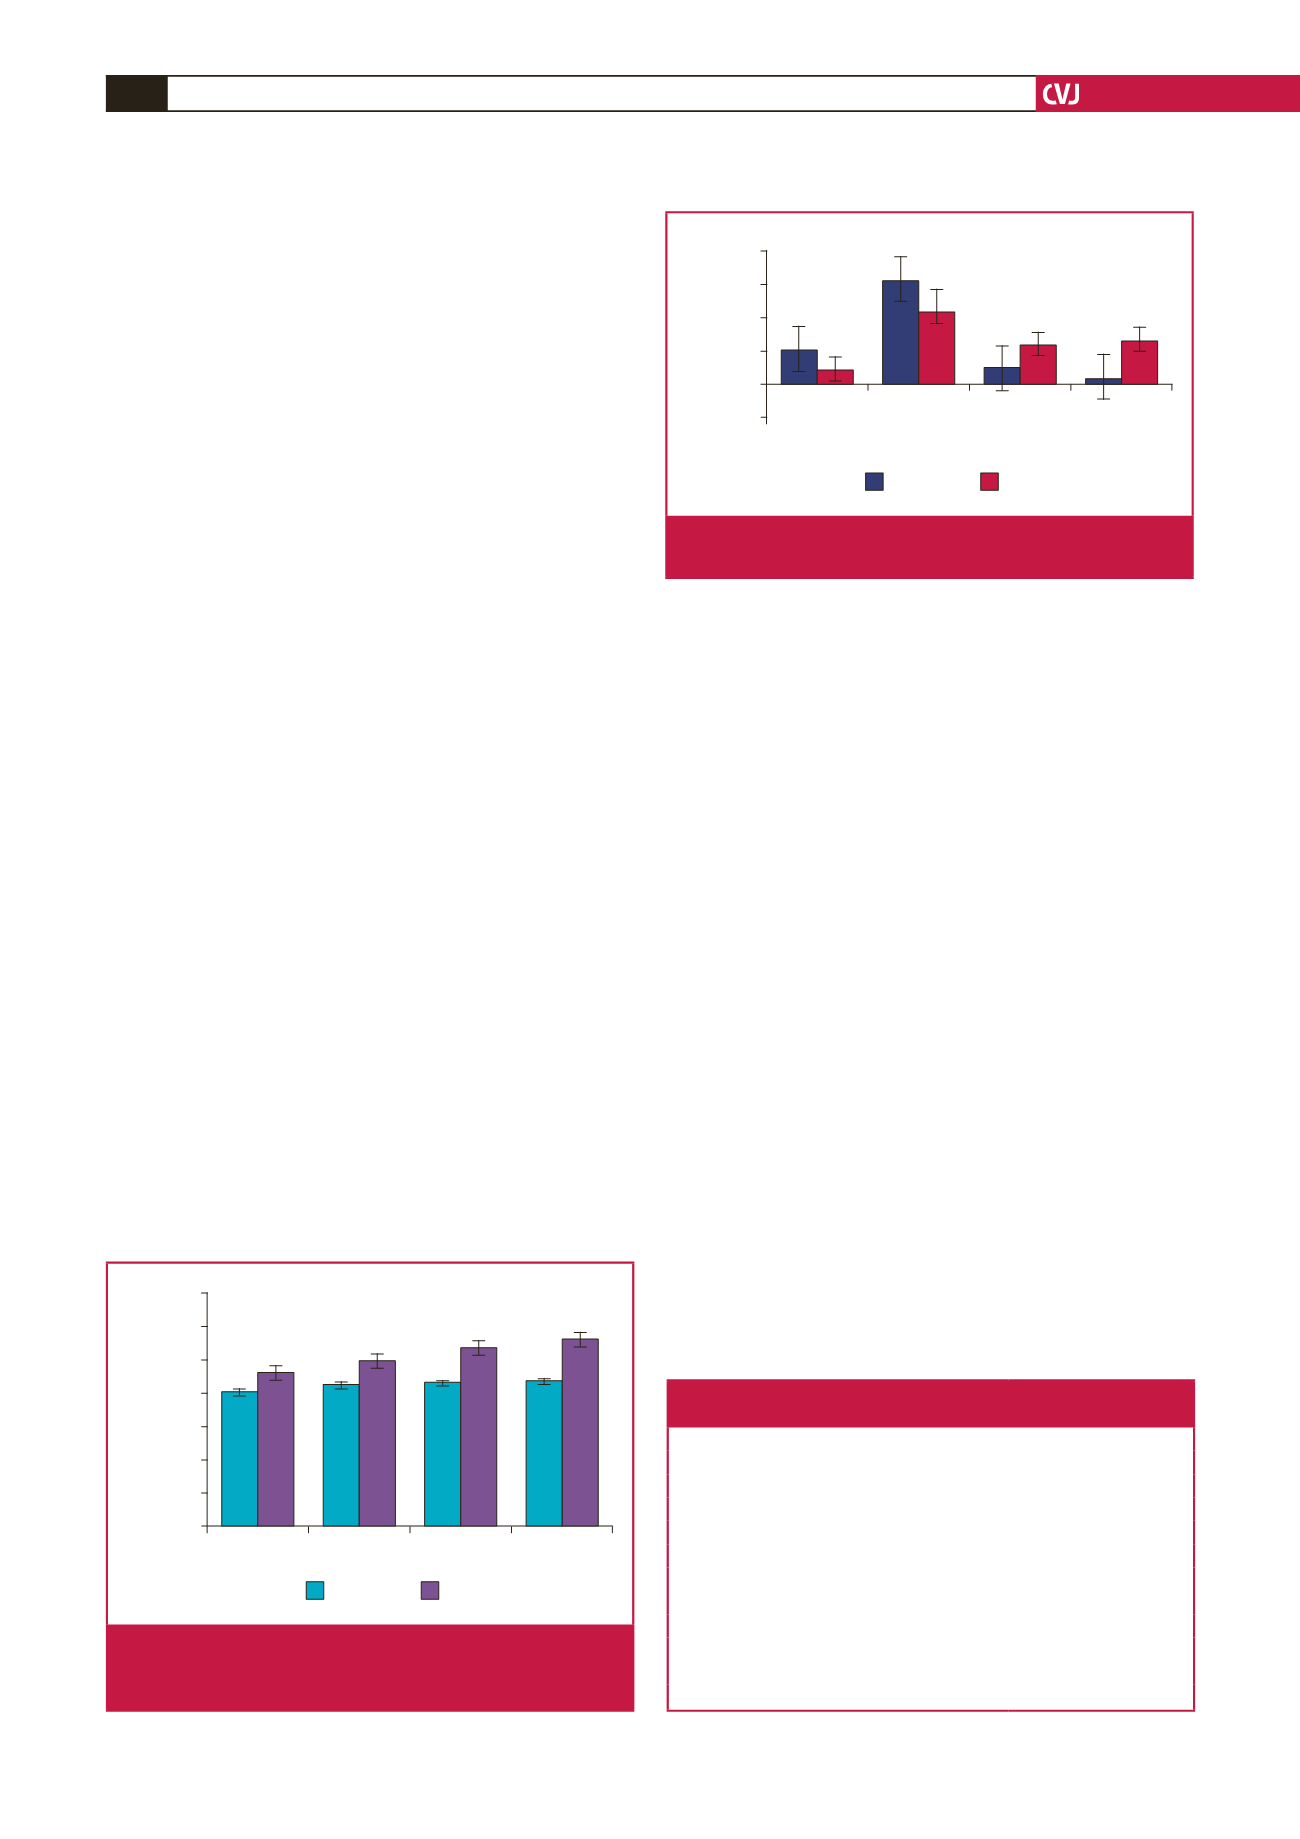
The mean BMI was 20.3–21.9 kg/m
2
in males and 23.2–28.1 kg/
m
2
in females (
p
≤
0.05). Mean BMI increased from 20.3 kg/m
2
in
the age group 18–20 years to 21.9 kg/m
2
in the age group 27–30
years in males, and from 23.2 to 28.1 kg/m
2
in females (Fig. 1).
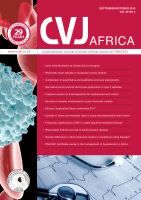
The distribution of BMI categories in the overall sample
was 8.6–20.5% for underweight, 9.3–23.1% for overweight and
3.1–25.8% for obesity. Equivalent figures were 20.5, 61.7, 9.3
and 3.1% in males, against 8.6, 43.5, 23.1 and 25.8% in females
(
p
≤
0.05 for the difference in the distribution of BMI categories
in males and females) (Fig. 2). Males had a higher incidence of
underweight (20.5%) than females. However, females (23.1 and
25.8%) showed a higher incidence than males (9.3 and 3.1%) of
overweight and obesity, respectively.
Fried chicken (23.8%), pap (22.6%), cold drink (16.9%) and
white sugar (14%) were the foods most frequently consumed
by the young Ellisras adults, while samp (2.6%), yogurt (2.4%)
and spinach (2.0%) were the least frequently consumed foods
(Table 1). Carbohydrates ranged between 78.2 and 84.5% while
total fats and saturated fats ranged between 31.6 and 42%, and
4.1 and 6.0%, respectively, for all BMI categories for the overall
population (Fig. 3).
In linear regression analyses, there was a borderline positive
association between cholesterol intake and BMI (
p
=
0.058),
with further enhancement after adjustment for age and gender
(beta
=
0.002,
p
=
0.035) (Table 2). Table 3 presents logistic
regression for the association between overweight/obesity and
low dietary intake. In logistic regression analyses, there was a
positive association between cholesterol intake and overweight
and obesity (
p
=
0.084), and after adjustment for age and gender,
the association of cholesterol intake with overweight and obesity
was significant (
p
=
0.020) (Table 3).
Discussion
This study aimed to investigate the relationship between dietary
intake and BMI among young rural Ellisras adults aged 18 to
30 years. There was a significant association between cholesterol
intake and BMI. Furthermore, a high prevalence was reported
of overweight and obesity among females compared to males in
the Ellisras population. These findings were in line with previous
Age group
20.3
21.5
21.7
21.9
23.2
2
26.8
28.1
18–20
21–23
24–26
27–30
BMI (kg/m
2
)
35
30
25
20
15
10
5
0
Males
Females
Fig. 1.
Descriptive statistics of mean body mass index by age
group and gender among young rural Ellisras adults
aged 18–30 years.
Nutritional status
20.5
61.7
9.3
3.1
8.6
42.5
23.1
25.8
Underweight
Normal
Overweight
Obese
Prevalence (%)
80
60
40
20
0
–20
Males
Females
Fig. 2.
The prevalence of malnutrition by gender among
young rural Ellisras adults aged 18–30 years.
Table 1.The most frequent food items in the diets for the overall
sample, from the most common food liked to the least liked
Variables
Percentage
Fried chicken with skin
23.8
Pap
22.6
Cold drink
16.9
White sugar
14
Vetkoek
5.8
Fried beef
4.7
Peanut butter
4.4
Samp
2.6
Yoghurt
2.4
Spinach
2.0
Pilchards
0.5