


 44 / 74

CARDIOVASCULAR JOURNAL OF AFRICA • Volume 30, No 2, March/April 2019
110
AFRICA
conditions. However, the smokers had significantly higher
oxygen saturation during the hypoxic exposure, but lower
oxygen saturation in the post-hypoxic period. They also had
higher mean heart rate (HR) during the whole session compared
to the non-smokers. HRV analysis showed that SDNN was
higher in non-smokers in the pre-hypoxic period but not during
hypoxia. RMSSD, SD1, SD2 and SD1/SD2 were higher in the
non-smokers during all three periods of the test. Sample entropy
was higher in the group of non-smokers under normoxic but not
hypoxic conditions (Table 2).
Frequency domain HRV analysis showed higher TP in the
non-smokers only during the pre-hypoxic period. HF was lower
in the smokers under both normoxic and hypoxic conditions.
LF was also lower but only during the pre-hypoxic normoxia.
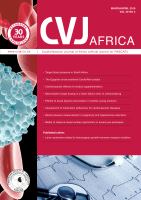
Non-smokers had a lower LF/HF index under normoxic (pre-
and post-hypoxia) conditions but no significant difference was
found during hypoxic exposure (Fig. 1).
When comparing intra-group changes of HRV when shifting
from hypoxic to post-hypoxic (normoxic) conditions, we found
that there was a significant increase in SDNN, RMSSD and HF
and a decrease in LF/HF, but these changes were observed in
only the group of non-smokers (Table 3). Peak frequency for HF
at the three different stages of the study was as follows: before
(0.21
±
0.06 ms
2
), during (0.21
±
0.07 ms
2
) and after hypoxia (0.21
±
0.05 ms
2
) and did not show significant difference (
p
=
1.000).
Discussion
When comparing groups of smokers and non-smokers under
normoxic conditions before hypoxic exposure, there was no
difference in the oxygen saturation, but smokers had significantly
higher heart rates and lower HRV. This means that tobacco
smoking leads to a decrease in the overall variability (total power
and SDNN), lower vagal activity (RMSSD, HF and SD1),
sympathetic predomination (higher LF/HF and lower SD1/SD2)
(Fig. 1) and lower complexity of the time series (sample entropy).
Impaired autonomic regulation in smokers has been studied
previously. Manzano
et al
. found that smoking a single cigarette
is a stress for the body and leads to a sudden change in
autonomic control, associated with sympathetic activation and
vagal withdrawal. These changes could be observed up to 30
minutes after smoking.
7
In our study, we tried to avoid the effect
of acute tobacco smoking, therefore our subjects did not smoke
for at least two hours prior to the test. We were thus able to assess
the long-term consequences caused by smoking.
The results of our study are in concordance with other
investigations who found impaired autonomic control with lower
HRV parameters in ‘heavy’ smokers with more than 15 pack-
years.
8,9
Although our subjects were much younger and with
less pack-years, we found the same HRV pattern. Even without
any clinical signs and symptoms, smokers had sympathetic
predominance (higher LF/HF and lower SD1/SD2). HRV
could therefore be used in clinical practice for the assessment of
impaired autonomic control in young smokers. Moreover, some
studies have shown that HRV parameters significantly increased
and LF/HF decreased after smoking cessation, which clearly
demonstrates the benefit of cessation.
17
When comparing the groups during exogenous hypoxic
exposure, we found that smokers had higher SpO
2
and HR, but
significantly lower HRV parameters (RMSSD, HF, SD1, SD2,
SD1/SD2), which means higher sympathetic activation as a
result of hypoxic provocation. Sympathetic over-activation or
higher SpO
2
in smokers could not be a result of higher ventilation
compared to non-smokers since nicotine does not increase the
peripheral chemoreceptor sensitivity and there was no difference
in the peak frequency of HF, which suggests no difference in the
respiratory rate of the two groups.
12,18
Moreover, it is well known
that chronic hypoxia causes pulmonary vasoconstriction and
pulmonary hypertension, which leads to ventilation/perfusion
mismatch and remodelling of the pulmonary vessels.
19,20
Brewer
et al.
demonstrated that smoking workers of Leadville,
Colorado (3 048 m) had higher haemoglobin affinity with oxygen
compared to non-smokers, most probably caused by the higher
levels of carboxyhaemoglobin, which shift the oxygen dissociation
curve to the left.
21,22
This could be a possible explanation for the
higher SpO
2
of smokers during hypoxia but not during normoxia,
since the difference in the oxygen dissociation curve of the
two groups was higher in lower pO
2
(high altitude).
23
However,
carboxyhaemoglobin levels were not part of the study design and
further tests are needed to confirm this hypothesis.
Wu
et al
. showed no difference in SpO
2
between smokers and
non-smokers at 4 525 m. However the authors concluded that
smoking slightly decreased the risk of acute mountain sickness
Table 3. Comparison of HRV parameters between hypoxic and normoxic
(post-hypoxic) conditions in smokers and non-smokers
Parameters
Non-smokers
Smokers
Hypoxia
Post-
Hypoxia
p
-value Hypoxia
Post-
Hypoxia
p
-value
HR (beat/min) 65.1
±
11.1 61.9
±
9.0 0.001 77.3
±
13.8 74.5
±
13.5 0.033
SDNN (ms)
75.7
±
41.1 87.8
±
39.2 0.055 57.9
±
28.1 61.3
±
25.3 0.656
RMSSD (ms) 65.9
±
40.2 75.1
±
45.9 0.011 34.3
±
17.1 34.9
±
20.0 0.914
lnLF (ms
2
)
7.6
±
1.1 7.6
±
0.9 0.963 7.1
±
0.9 7.0
±
0.8 0.983
lnHF (ms
2
)
6.8
±
1.4 7.2
±
1.3 0.014 5.8
±
1.2 5.8
±
1.1 0.912
lnTP (ms
2
)
8.2
±
1.2 8.5
±
0.9 0.099 7.9
±
1.0 7.9
±
0.9 0.785
LF/HF
3.0
±
2.3 1.9
±
1.5 < 0.001 3.8
±
1.6 4.0
±
1.8 0.657
HF: high frequency, HR: heart rate, LF: low frequency, SDNN: standard deviation
of the intervals between normal beats, RMSSD: mean square root of successive R-R
interval differences, TP: total power.
Periods
Pre-hypoxia
Hypoxia
Post-hypoxia
LF/HF index
8
7
6
5
4
3
2
1
0
Non-smokers
Smokers
Error bars: 95% CI
Fig. 1.
Comparison of LF/HF index between smokers and
non-smokers under normoxic and hypoxic conditions.