


 24 / 64

CARDIOVASCULAR JOURNAL OF AFRICA • Volume 30, No 4, July/August 2019
210
AFRICA
means of three groups. Inherent in the Graphpad Prism is the
F
-test for variances to justify the
t
-test and the Bartlett’s test to
justify ANOVA. A
p
-value less than 0.05 was considered to be
statistically significant. Bonferroni’s multiple comparison test
was done to show actual differences between the three groups.
Results
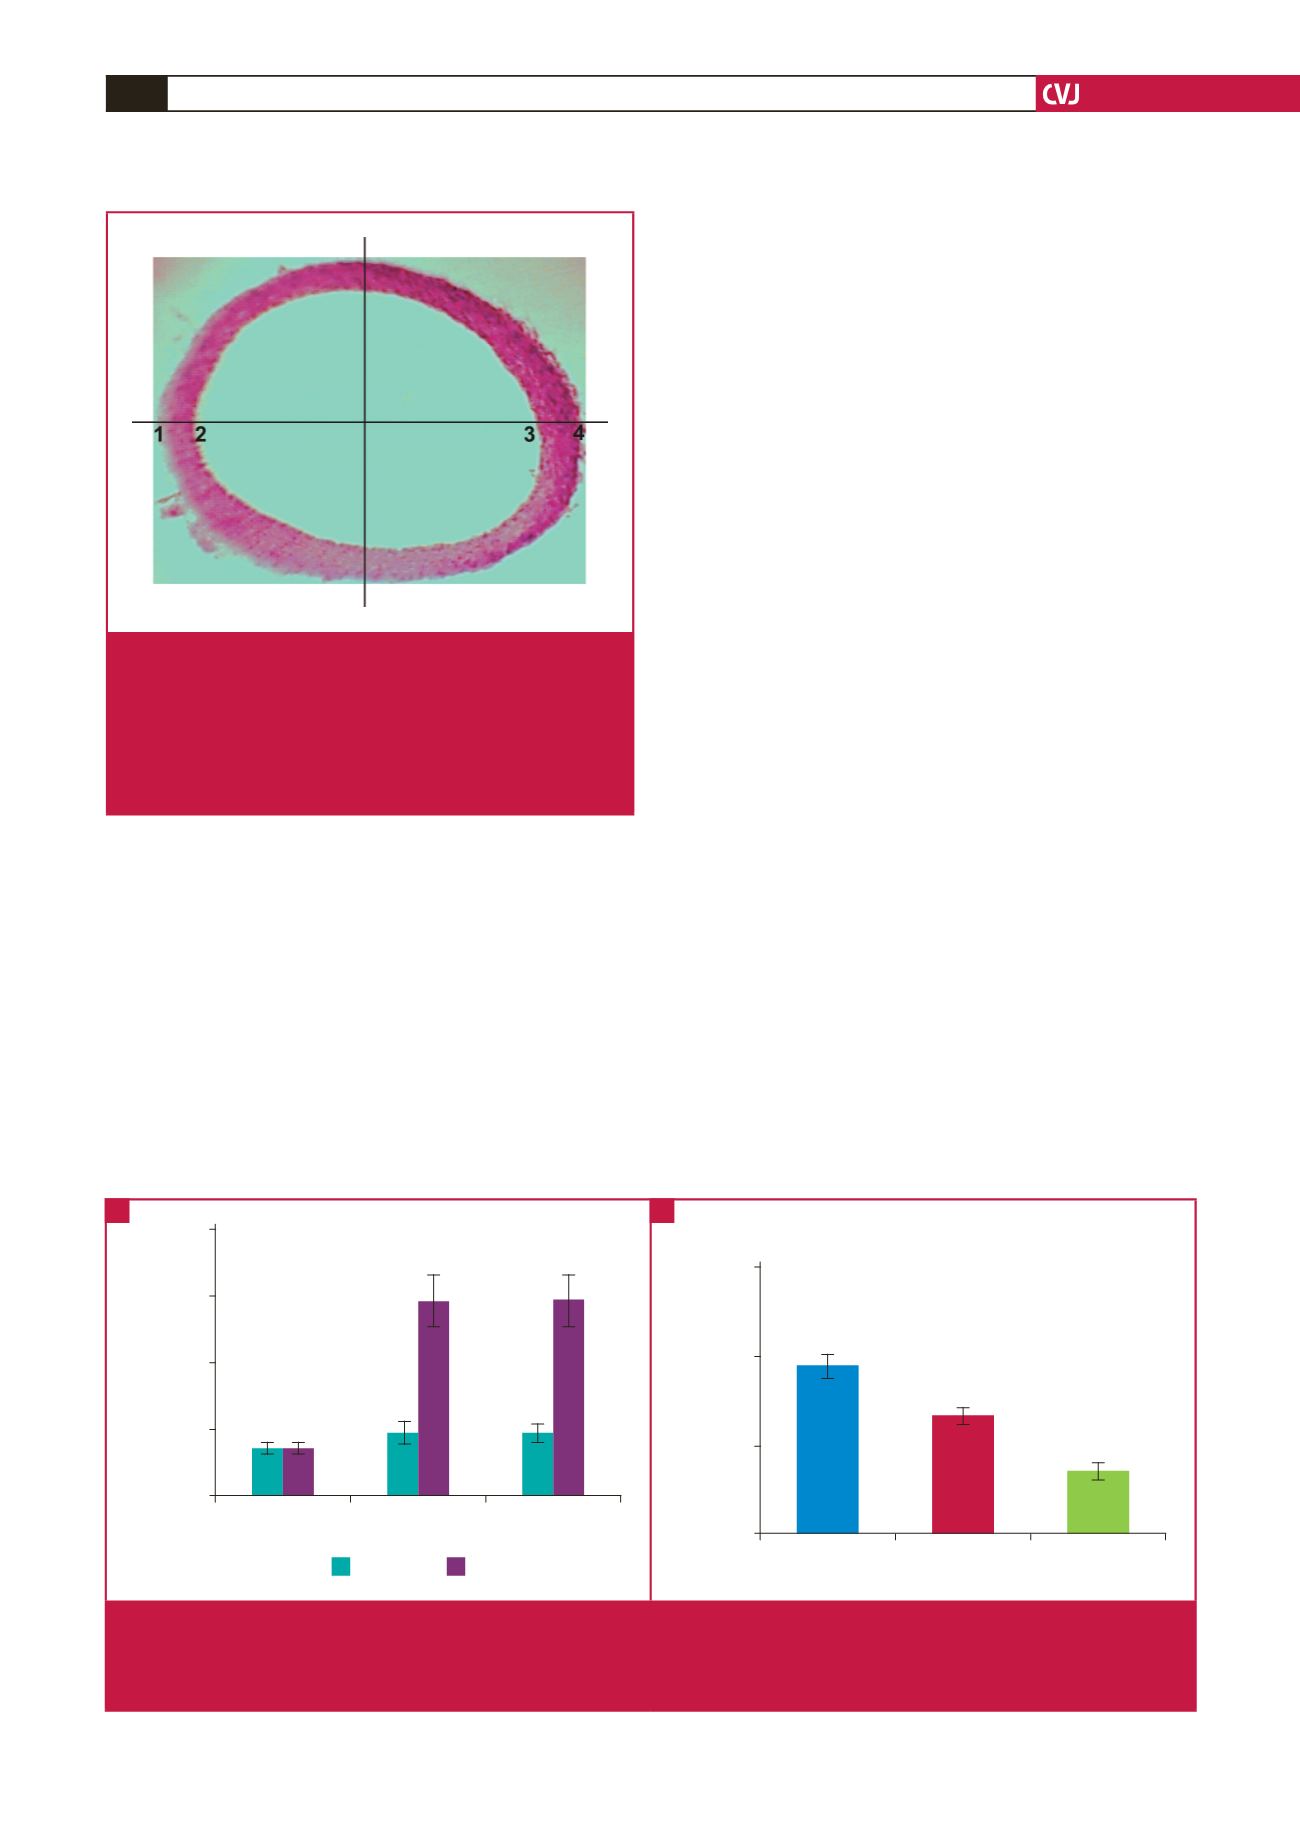
After feeding the female rabbits with a 0.5% cholesterol diet, the
mean total plasma cholesterol of the HC and HCC groups were
significantly higher than baseline concentrations. Cholesterol
levels increased three-fold from the initial concentration for both
groups after two weeks of treatment, as shown in Fig. 2A. In the
HC group, total cholesterol levels increased from 2.38 (SD 0.81)
to 7.33 (SD 1.93) mmol/l and that of the HCC group increased
from 2.35 (SD 0.68) to 7.40 (SD 2.05) mmol/l. Cholesterol level
of the control rabbits was unchanged at 1.8 (SD 0.28) before and
after the same two-week period.
The mean total cholesterol levels of the offspring of the NC,
HC and HCC rabbits were 9.47 (SD 1.56), 6.73 (SD 0.87) and
3.60 (SD 0.66) mmol/l, respectively (Fig. 2B). Statistical analysis
showed significant differences between the total cholesterol levels
of offspring of the different treatment groups (
p
=
0.0002,
F
=
23.1 and df
=
2). Bonferroni’s multiple comparison test indicated
significant differences between the NC and HC groups (
p
<
0.05),
the NC and HCC groups (
p
<
0.0001), and the HC and HCC
groups (
p
<
0.05).
Histological sections of the aortic arch of the rabbit offspring
showed intima–media thicknesses of 58.5 (SD 6.02) µm for
the NC, 146 (SD 18.24) µm for the HC and 99 (SD 4.87) µm
for the HCC groups. ANOVA showed significant differences
(
p
<
0.0001,
F
=
149.2 and df
=
2) between the intima–media
thickness of the aortic arch between the three groups, as
shown in Fig. 3. Bonferroni’s multiple comparison test showed
significant differences between the NC and HC groups (
p
<
0.001), the NC and HCC groups (
p
<
0.001), and the HC and
HCC groups (
p
<
0.001).
Histological sections of the aortic arch revealed intimal lipid
accumulations or lesions on all five sections per pup in the HC
group (100%), whereas no lesions were observed on any of the
five sections per pup from the NC and HCC groups (Fig. 4). In
the descending thoracic segment of the aorta, again no lesions
were found on sections from the NC group, as shown in Fig. 5.
Lesions were present on 40% of the sections from the HC group
and 20% of the sections from the HCC group. In the abdominal
aorta, no lesions were present in any section of the three groups
of rabbit pups.
Increased deposition of collagen and smooth muscle in
vascular walls is associated with advanced atherosclerosis,
29
and
so collagen and elastic fibre deposition were assessed by staining
with VVG. Collagen and elastic fibres within the intima of the
D
D
E
E
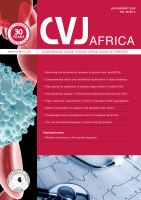
Fig. 1.
Micrograph of H & E-stained section of the aorta illus-
trating intima–media thickness measurements. Two
perpendicular lines (EE and DD) were drawn across
the micrograph in Photoshop. Two measurements
for intima–media thickness (IMT) were measured
between points 1/2 and 3/4. The average IMT for each
section was then computed.
Treatment groups of rabbits
NC
HC
HCC
Total cholesterol (mmol/l)
10.0
7.5
5.0
2.5
0.0
before
after
*
*
Offspring of treatment groups of rabbits
NC
HC
HCC
Total cholesterol (mmol/l)
15
10
5
0
*
**
#
Fig. 2.
Bar charts showing total plasma cholesterol concentrations. (A) shows total plasma cholesterol concentration of the moth-
ers in all three groups before and after consuming a cholesterol-enriched diet for two weeks. (B) shows the mean plasma
cholesterol level of the offspring. *
p
<
0.05 compared to control or baseline, **
p
<
0.001 and
#
p
<
0.05 compared to the HC
group. Error bars indicate standard deviation.
A
B