


 32 / 64

CARDIOVASCULAR JOURNAL OF AFRICA • Volume 30, No 4, July/August 2019
218
AFRICA
There was a positive correlation between RV free-wall PSS
and LVGLS in patients with CRMR (
r
=
0.3,
p
<
0.001). The
majority of patients (45%) had preserved RV free-wall PSS and
LVGLS, 26% had decreased LVGLS and RV free-wall PSS, 18%
had diminished LVGLS and preserved RV free-wall PSS, and a
minority (11%) had preserved LVGLS with decreased RV free-
wall PSS (Fig. 2).
By univariate linear regression analysis, severe MR, grade
≥
2+ TR, PASP, LVEF, LV end-diastolic diameter, lateral S
′
and LVGLS showed a significant association with RV free-wall
PSS, with LVGLS having the strongest correlation (Table 5). By
multivariate linear regression analysis after adjusting for age
and gender, LVGLS and grade
≥
2+ TR emerged as the most
important predictors of RVPSS (Table 5).
RV free-wall PSS measurements were feasible in 76 patients.
In one patient, RV free-wall PSS was not feasible due to poor
imaging of the lateral wall, however, LVGLS could be quantified.
The intra-observer coefficient of variation for RV free-wall PSS
was 7% with a mean difference
±
SD of 0.4
±
2.7 (
p
=
0.5), and
for LVGLS it was 2.4% with a mean difference
±
SD of 1.1
±
2.7
(
p
=
0.09). The inter-observer variability coefficient was 7.6% for
RV free-wall PSS with a mean difference
±
SD of 0.5
±
3.8 (
p
=
0.5) and for LVGLS it was 9.8% with a mean difference
±
SD of
0.25
±
2.4 (
p
=
0.6).
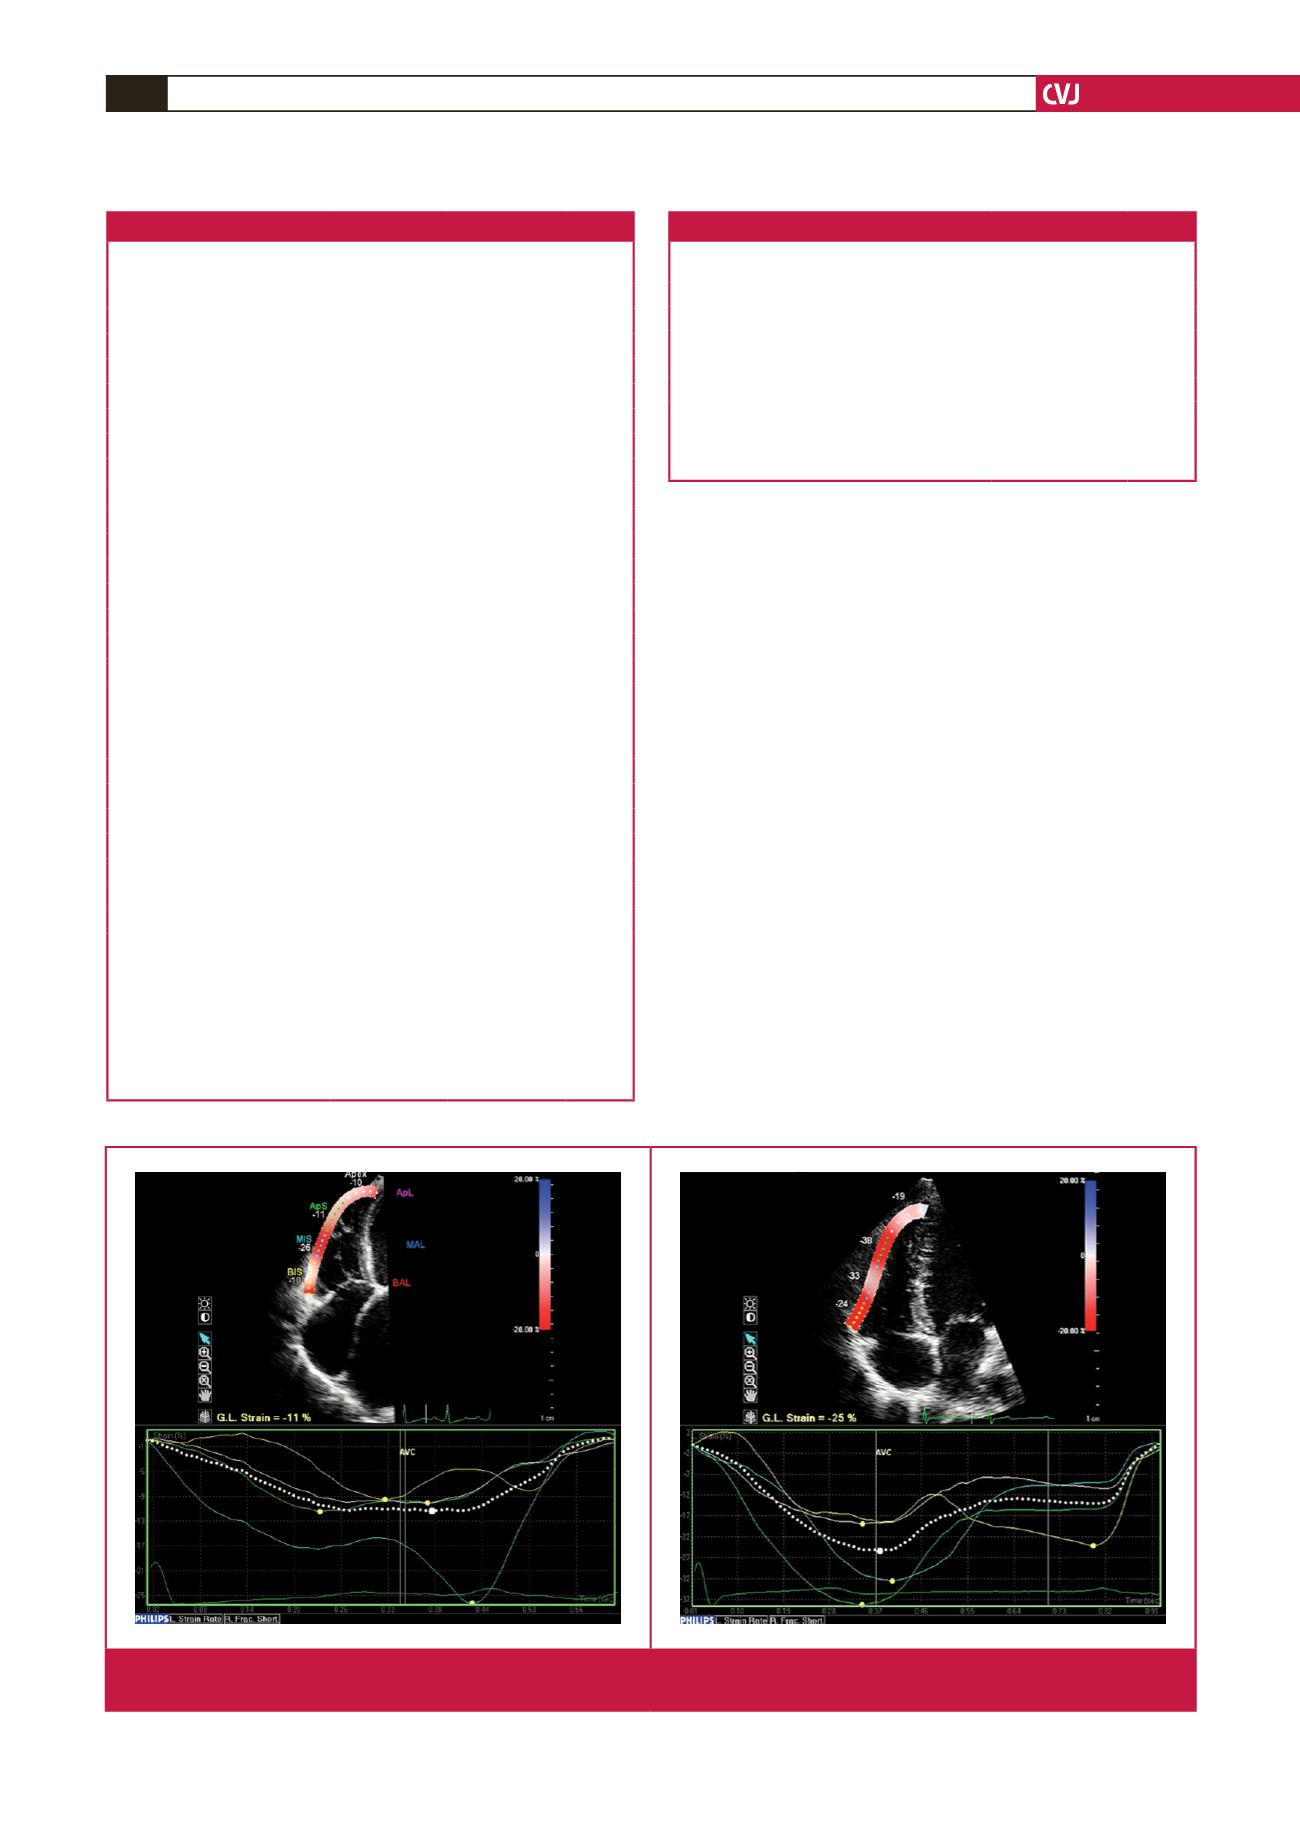
Fig. 1.
Reduced RV free-wall peak systolic strain (PSS) in a chronic rheumatic mitral regurgitation patient (left) compared to normal
RV free-wall PSS in a control subject (right).
Table 2. Echocardiographic parameters of the study population
Variable
CRMR patients
(
n
=
77)
Controls
(
n
=
40)
p
-value
LV parameters
EDD (mm)
54.8
±
9.4
42.5
±
4.8
<
0.0001
ESD (mm)
41.4
±
9.4
27.1
±
4.2
<
0.0001
LVPWD (mm)
8.5
±
1.5
9.2
±
1.9
0.03
EDVi (ml/m
2
)
†
93.2
±
30.1
47.9
±
13.5
<
0.0001
ESVi (ml/m
2
)
†
40.0
±
22.2
17.8
±
6.4
<
0.0001
LAVi (ml/m
2
)
†
64.1
±
39.9
21.9
±
4.9
<
0.0001
EF (%)
58.5
±
12.9
62.8
±
11.2
0.07
LVMi (kg/m
2
)
†
102.7
±
36.3
65.6
±
20.3
<
0.0001
E wave (cm/s)
133.8
±
48.1
77.0
±
17.6
<
0.0001
A wave (cm/s)
98.4
±
33.5
59.6
±
13.0
<
0.0001
E
′
medial (cm/s)
7.3
±
2.3
8.8
±
2.8
0.002
E
′
lateral (cm/s)
10.1
±
4.0
13.4
±
3.6
<
0.0001
E/E
′
medial (cm/s)
20.1
±
10.7
9.4
±
3.0
<
0.0001
E/E
′
lateral (cm/s)
15.4
±
8.8
5.9
±
1.6
<
0.0001
S
′
medial (cm/s)
6.3
±
1.3
7.1
±
1.6
0.004
S
′
lateral (cm/s)
7.3
±
2.5
8.2
±
2.6
0.07
LV GLS (%)
–16.1
±
5.3
–17.9
±
2.1
0.04
RV parameters
RV base (mm)
32.1
±
6.9
30.8
±
4.7
0.28
RVS
′
(cm/s)
11.5 (9.7–13.8) 11.6 (10.5–13.4)
0.29
TAPSE (cm)
2.1
±
0.4
2.2
±
3.2
0.78
RAVi (ml/m
2
)
†
23.1
±
12.9
18.6
±
5.4
0.03
TR (grade
≥
2+ TR) (%)
30%
–
–
PASP (mmHg)
35.1
±
16.9
22.1
±
5.6
<
0.0001
RV free-wall PSS (%)
–16.8
±
4.5
–19.2
±
3.4
0.003
Data are presented as mean
±
SD or %.
†
Values are indexed to BSA.
CRMR, chronic rheumatic mitral regurgitation; EDVi, end-diastolic volume
indexed; ESVi, end-systolic volume indexed; IVSD, interventricular septal
diameter; LAVi, left atrial volume indexed; EDD, end-diastolic diameter; EF,
ejection fraction; ESD, end-systolic diameter; GLS, global longitudinal strain;
LV, left ventricle; LVMi, left ventricular mass indexed; NYHA, New York Heart
Association; PASP, pulmonary artery systolic pressure; PWD, posterior wall
diameter; PSS, peak systolic strain; RAVi, right atrial volume indexed; RV, right
ventricle; TAPSE, tricuspid annular plane systolic excursion.
Table 3. RV systolic function parameters according to severity of MR
Variable
Moderate CRMR
(
n
=
51)
Severe CRMR
(
n
=
26)
p-
value
RV wall thickness (mm)
5.9
±
1.6
7.2
±
2.3
0.006
PASP (mmHg)
31.0
±
12.3
43.9
±
21.3
0.001
RVS
′
(cm/s)
11.6 (9.9–14.6)
11.4 (9.4–13.4)
0.29
TAPSE (cm)
2.1
±
0.38
2.0
±
0.4
0.28
RV free-wall PSS (%)
–17.7
±
4.2
–15
±
4.7
0.01
Data are presented as median (IQR), mean
±
SD. CRMR, chronic rheumatic
mitral regurgitation; PASP, pulmonary artery systolic pressure; PSS, peak
systolic strain; RV, right ventricle; TAPSE, tricuspid annular plane systolic
excursion.