


 33 / 64

CARDIOVASCULAR JOURNAL OF AFRICA • Volume 30, No 4, July/August 2019
AFRICA
219
Discussion
The pertinent findings of this study are firstly, that RV free-
wall PSS is a sensitive marker of subclinical RV dysfunction
in CRMR patients, as evidenced by depressed RV free-wall
PSS when conventional clinical measures of RV function were
normal. This trend was observed with CRMR patients compared
to controls, moderate compared to severe MR and between
those with normal LVEF and those with depressed LVEF.
Secondly, LVGLS and significant TR were the most important
determinant of RV free-wall PSS.
RV functional impairment and decreased LVEF are powerful
predictors of cardiovascular and overall survival in degenerative
MR.
6
The main determinants of RV function in MR are RV
load, myocardial function, neuro-hormonal abnormalities and
ventricular interaction.
5,26
Only RV free-wall PSS was measured in this study as the
interventricular septum contributes minimally to RV function.
27
RVPSS is known to have prognostic and predictive value in
various cardiovascular disease states.
1,27
In this study RV systolic
dysfunction was more prevalent by STE than with commonly
used conventional markers of systolic function such as TAPSE
and RVS
′
. STE-derived RVPSS has been shown to be feasible
and reproducible for clinical use.
1,11,12
In this study RV free-wall
PSS was feasible and reproducible in assessing RV function
in CRMR. STE has been shown to be advantageous over
conventional echocardiographic parameters used to measure RV
systolic function in a variety of cardiovascular disorders such
as heart failure, pulmonary hypertension and pre-operative and
postoperative RV function assessment.
6,11,12,13,28
This finding can be explained by technical aspects, as speckle-
tracking is angle independent and less influenced by heart
motion compared to TAPSE and RVS
′
.
1
Additionally, TAPSE
and S
′
only measure regional RV function, whereas RV free-wall
PSS is able to provide more global assessment of RV function.
1
Furthermore, Focardi
et al
. recently showed that among all RV
systolic function parameters, RVPSS had the best correlation
with RVEF measured by cardiac magnetic resonance imaging.
29
Therefore, although STE is limited by image quality and load
Table 4. Comparison of RV systolic function parameters
in CRMR according to LV systolic function
Variable
LVEF
<
60%
(
n
=
32)
LVEF
≥
60%
(
n
=
45)
p-
value
RVS
′
(cm/s)
11.3 (9.7–13.0)
12.0 (9.6–14.7)
0.27
TAPSE (cm)
1.9
±
0.30
2.1
±
0.41
0.07
LVGLS (%)
–13.1
±
5.6
–18.2
±
3.9
<
0.001
RVPSS (%)
–14.6
±
4.1
–18.2
±
4.2
0.0003
PASP (mmHg)
39.9
±
21.5
31.6
±
11.5
0.03
Data are presented as median (IQR), mean
±
SD or %. EDD, end-diastolic
diameter; GLS, global longitudinal strain; LV, left ventricle; PASP, pulmonary
artery systolic pressure; PSS, peak systolic strain; RV, right ventricle; RVH, right
ventricular hypertrophy; TAPSE, tricuspid annular plane systolic excursion.
Table 5. Predictors of RV free-wall PSS in chronic rheumatic mitral
regurgitation: uni- and multivariate linear regression analysis
Univariate models
R
-value
Adjusted
R
2
p
-value
Age (years)
0.06
0.004
0.56
Gender (M)
0.14
0.008
0.20
LVEF (%)
0.33
0.09
0.003
LVEDD (mm)
0.29
0.07
0.009
Lateral S
′
(cm/s)
0.24
0.04
0.03
PASP (mmHg)
0.31
0.08
0.006
Severe MR
0.29
0.07
0.008
LVGLS (%)
0.44
0.18
<
0.001
Grade
≥
2+ TR
0.42
0.16
0.0001
Multivariate model
R
=
0.56,
p
<
0.0001
LVGLS (%)
0.40
0.07
0.0004
Grade
≥
2+ TR
0.37
0.07
0.001
Multivariate model
R
=
0.58,
p
<
0.0001
LVGLS (%)
0.35
0.08
0.0009
Grade
≥
2+ TR
0.38
0.46
0.005
PASP (mmHg)
–0.0007
0.44
0.99
Multivariate model
R
=
0.57,
p
<
0.0001
LVGLS (%)
0.39
0.08
0.0006
Grade
≥
2+ TR
0.29
0.24
0.01
Severe MR
0.12
0.26
0.27
Multivariate model
R
=
0.56,
p
<
0.0001
LVGLS (%)
0.30
0.34
0.008
Grade
≥
2+ TR
0.36
0.08
0.001
LVEF (%)
–0.08
0.31
0.45
Multivariate model
R
=
0.55,
p
<
0.0001
LVGLS (%)
0.33
0.29
0.004
Grade
≥
2+ TR
0.36
0.07
0.002
Lateral S
′
(cm/s)
–0.04
0.38
0.69
Multivariate model
R
=
0.5,
p
<
0.001
LVGLS (%)
0.34
0.16
0.002
Grade
≥
2+ TR
0.36
0.05
0.001
LVEDD (mm)
0.13
0.14
0.26
EDD, end-diastolic diameter; EF, ejection fraction; GLS, global longitudinal
strain; LV, left ventricle; MR, mitral regurgitation; PASP, pulmonary artery
systolic pressure; TR, tricuspid regurgitation.
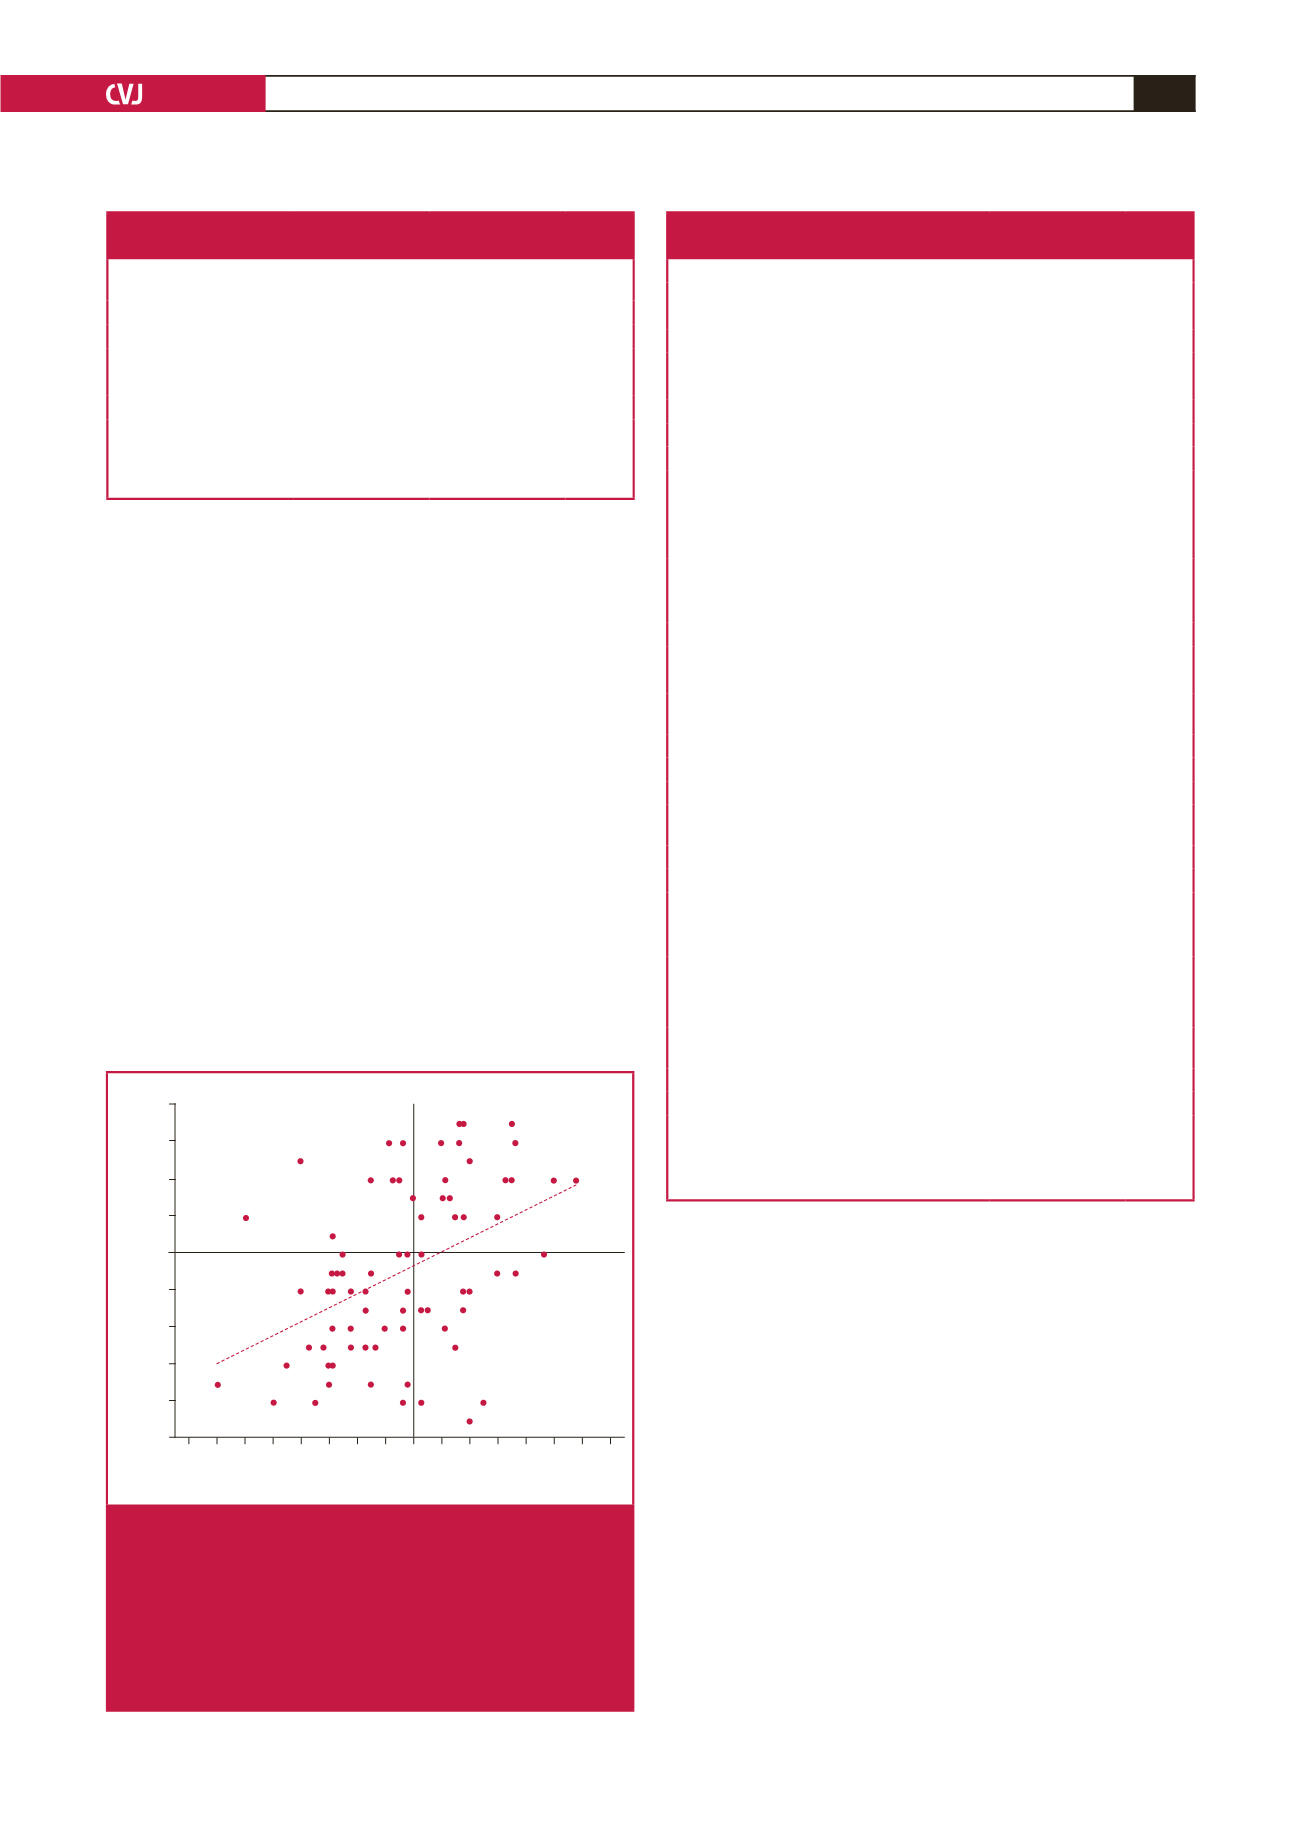
LV global longitudinal strain (%)
–32 –30 –28 –26 –24 –22 –20 –18 –16 –14 –12 –10 –8 –6 –4 –2
RV free wall peak systolic strain (%)
–8
–10
–12
–14
–16
–18
–20
–22
–24
–26
Category 1
Category 4
Category 2
Category 3
Fig. 2.
Correlation between RV free-wall peak systolic strain
(PSS) and LV global longitudinal strain (LVGLS) in
chronic rheumatic mitral regurgitation (
R
2
=
0.1984,
p
<
0.001). Category 1, normal LVGLS and normal
RV free-wall PSS; category 2, normal LVGLS and
decreased RV free-wall PSS; category 3, decreased
LVGLS and decreased RV free-wall PSS; category 4,
decreased LVGLS and normal RV free-wall PSS.