
CARDIOVASCULAR JOURNAL OF AFRICA • Volume 30, No 6, November/December 2019
332
AFRICA
For resting gated SPECT myocardial perfusion imaging,
empirical radioactivity of 555–1 110 MBq of Tc-99m sestamibi
was administered intravenously. After a delay of approximately
60 minutes, patients were positioned supine with both arms
raised above the head. ECG gated myocardial perfusion data
was acquired with a dual-head gamma camera (General Electric
Hawkeye, GE) equipped with a low-energy, high-resolution
collimator. Twenty-four datasets in frame mode were acquired
per cardiac cycle at 30 seconds per step. Data were stored in a
64
×
64 matrix. A 17-segment model was used to analyse the
myocardium of the left ventricle.
Perfusion defects were scored between 0 and 4. A Tc-99m
sestamibi uptake score of 0 represents normal perfusion; 1 is
allocated when there is equivocal or mildly reduced uptake. A
score of 2 indicates moderately reduced uptake, 3 represents
severely reduced uptake and a score of 4 is assigned when there
is absent uptake. Patients demonstrating evidence of transmural
perfusion defects (scores 3 and 4) concomitantly with abnormal
wall motion were then selected for further imaging with PET.
This approach was done to exclude patients with a non-ischaemic
dilated cardiomyopathy.
For cardiac PET imaging, fasting blood glucose levels were
used to determine the total dose for oral glucose loading.
Patients received an oral glucose dose of 25–75 g of dextrose
monohydrate glucose (Medicolab) diluted in 200 ml of water.
This was then followed by a finger-prick to determine the blood
glucose level. F18-FDG radioactivity of 185–370 MBq was then
injected intravenously.
After a delay of approximately 45 minutes from the time
of the radiopharmaceutical injection, patients were positioned
supine with both arms raised above the head and a Siemens
Biograph Somaton Sensation 40 PET/CT camera was used
for the acquisition of cardiac PET images. These images were
acquired in three-dimensional mode for 10 minutes per bed
position. A low-dose computed tomography was used for
attenuation correction. The images were then segmented in the
short-axis, vertical and longitudinal long-axis planes.
Each segment of the myocardium was also scored between
0 and 4, where a score of 0 represents preserved FDG uptake
and 4 represents absent FDG uptake. The segments of the
myocardium with a Tc-99m sestamibi uptake score that was
more severe than the reduction in FDG uptake by one or more
points was considered viable (Fig. 2).
The percentage of total viable myocardium was calculated
by dividing the number of segments demonstrating a perfusion–
metabolismmismatch by
17.Wesubsequentlymultiplied the value
obtained by 100 to obtain a percentage of viable myocardium.
We further classified patients into those with viability exceeding
10% of the total myocardium, less than 10% viability of the total
myocardium and those with no viable segments.
Statistical analysis
The statistics were generated with STATA MP version 13.0
(StataCorp, Texas). Normally distributed continuous variables
were summarised as mean and standard deviation. The median
and interquartile ranges were used for continuous variables with
a skewed distribution. The chi-squared test was used to compare
categorical variables. Both univariable and multivariable
regression analyses were used to find independent predictors
of myocardial viability. Confidence intervals were calculated at
95% interval levels and differences were considered statistically
significant at a
p
-value of
<
0.05.
Results
The study population consisted of 236 patients. There were 196
(83.1%) males and the mean age was 59.1
±
11 years. More than
half of the patients were Caucasians (53.0%), with only 13.6%
classified as black. The median fasting blood glucose level was
5.8 mmol/l (interquartile range: 5.2 – 6.9). The mean systolic and
diastolic blood pressure was 127.0
±
22.3 and 77.5
±
13 mmHg,
respectively. The rest of the demographic and clinical parameters
are summarised in Table 1.
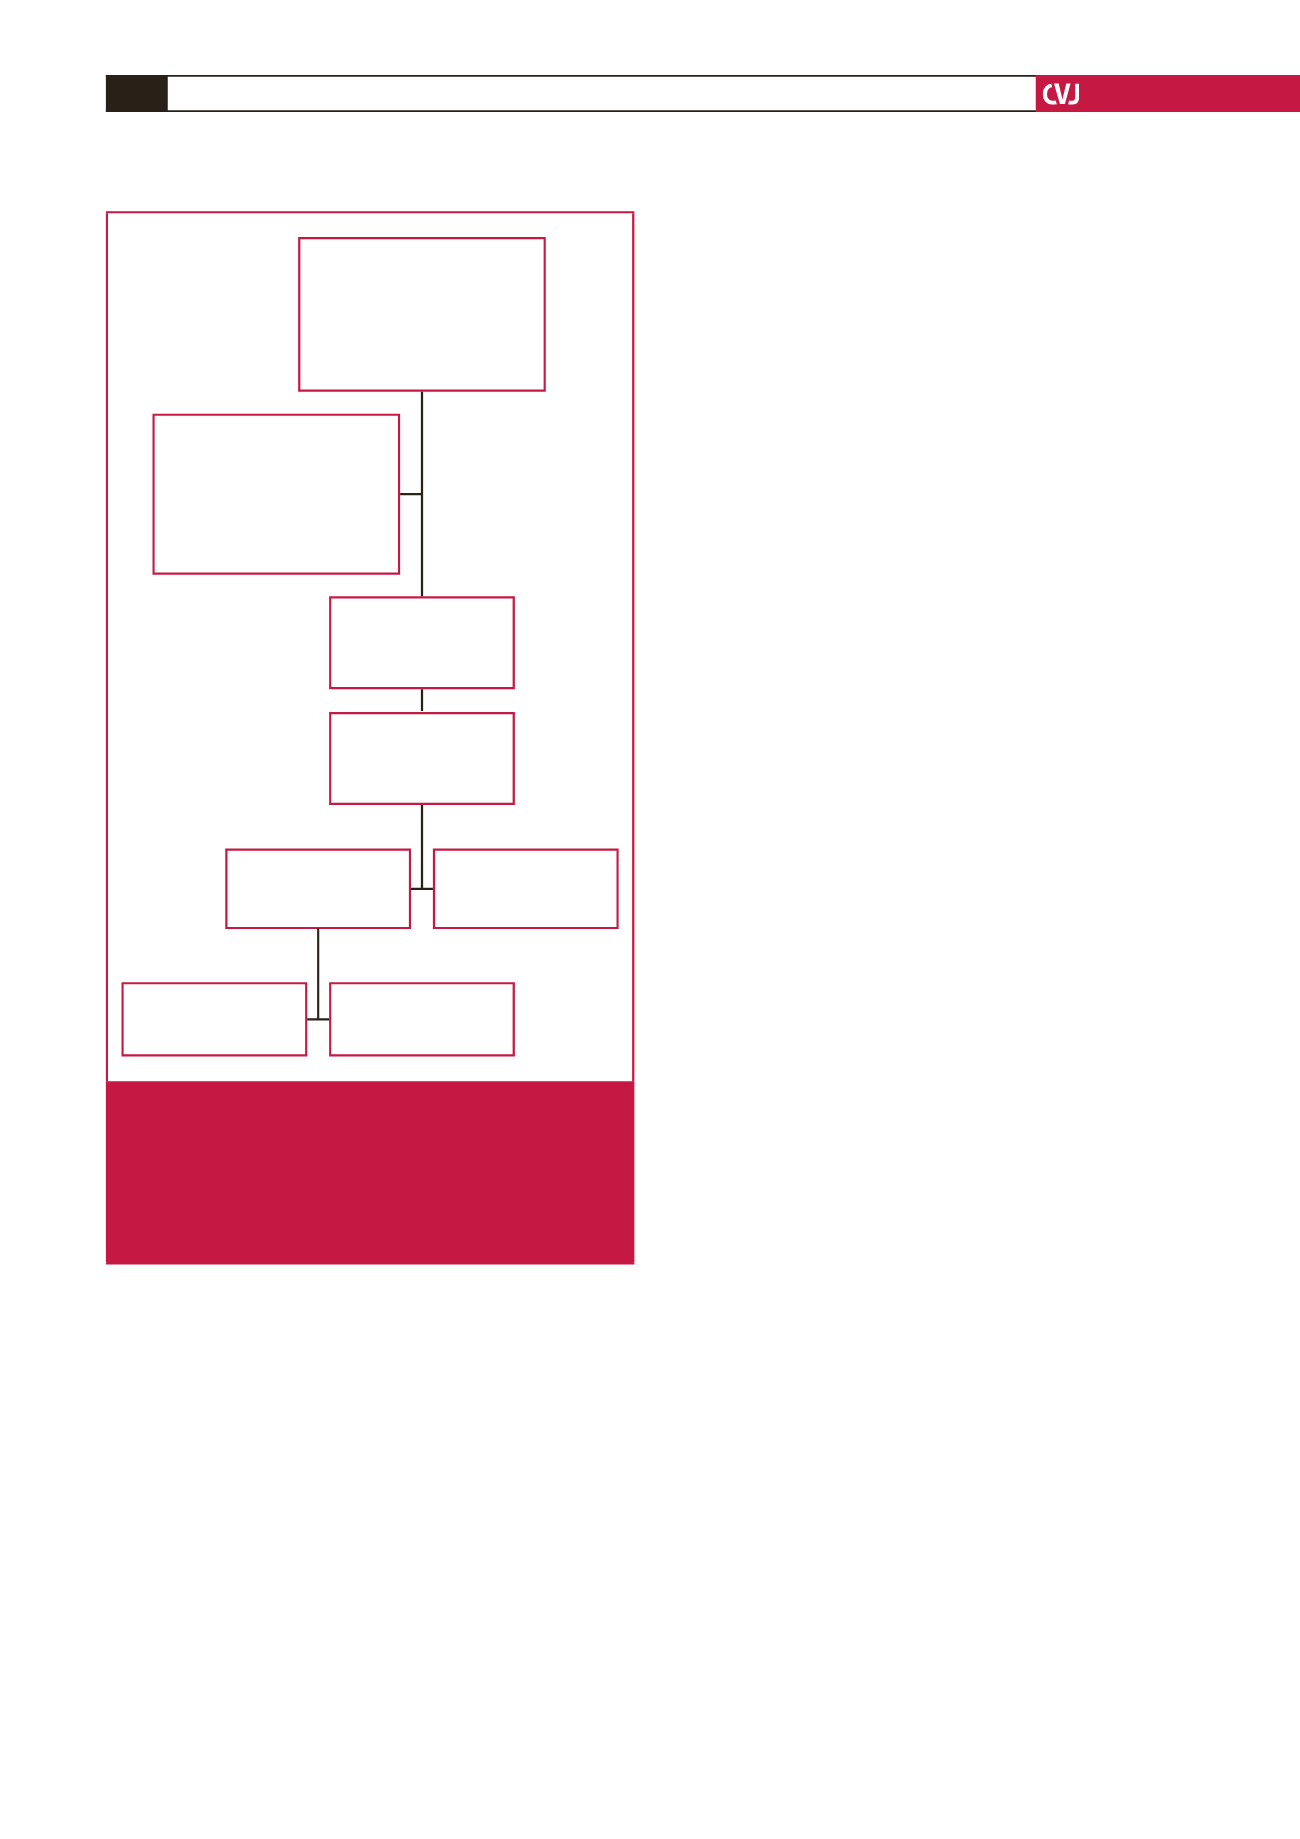
Myocardial perfusion and cardiac PET imaging findings: A
total of 4 012 segments of the left ventricle were evaluated for
the presence of perfusion defects; 1 862 segments had perfusion
Technetium-99m sestamibi
gated SPECT perfusion and
F18-FDG cardiac PET reports
of consecutive patients with
an ischaemic cardiomyopathy
imaged from January 2009 to
June 2015 (
n
= 240)
Excluded patients: (
n
= 4)
viability imaging done with
thallium-201 chloride SPECT
(
n
= 1)
imaged outside the referral
network (
n
= 1)
missing perfusion scan results
(
n
= 2)
Patients recruited into
the study meeting the
inclusion criteria
(
n
= 236)
Segments of the left
ventricle analysed
(17-segment model)
(
n
= 4 012)
Segments with reduced
or absent perfusion
(
n
= 1 862)
Segments with normal
perfusion
(
n
= 2 150)
Perfusion–metabolism
match
(
n
= 1 276)
Perfusion–metabolism
mismatch
(
n
= 586)
Fig. 1.
Flow chart of the study showing patients referred for
imaging with technetium-99m sestamibi gated single-
photon emission computed tomography (SPECT)
and fluorine-18 fluorodeoxyglucose positron emission
tomography (F18-FDG PET). Segments demonstrat-
ing normal perfusion are considered viable and were
not subjected to further analysis on PET imaging.


