
CARDIOVASCULAR JOURNAL OF AFRICA • Volume 30, No 6, November/December 2019
AFRICA
327
MetS.
22
Accordingly, abdominal SAT should be considered as
two functionally distinct compartments rather than a single
entity.
22
A suggestion for further investigation in this population
would be to explore the role of sSAT and dSAT using alternative
imaging methods, such as computerised tomography or magnetic
resonance imaging, as DXA is unable to differentiate between
sSAT and dSAT.
Unlike associations with insulin sensitivity, the associations
Men:
r
= 0.702,
p
= 0.635
Women:
r
= 0.205,
p
= 0.008
Triglycerides (mmol/l)
3
2
1
0
30 32 34 36 38 40 42 44 46 48 50 52 54 56 60 62 64 66 68 70
Trunk fat (%FM)
M F
Men:
r
= 0.074,
p
= 0.626
Women:
r
= 0.434,
p
= 0.008
Triglycerides (mmol/l)
3
2
1
0
–1
1 2 3 4 5 6 7 8 9 10 11 12 13 14 15
Android fat (%FM)
M F
Men:
r
= 0.307,
p
= 0.038
Women:
r
= 0.466,
p
≤
0.001
Triglycerides (mmol/l)
3
2.5
2
1.5
1
0.5
0 100 200 300 400 500
VAT (cm
2
)
M F
Men:
r
= 0.081,
p
= 0.591
Women:
r
= 0.500,
p
≤
0.001
Triglycerides (mmol/l)
3
2
1
0
15 17 19 21 23 25 27 29 31 33 35 37 39 41 43 45 47 49 51 53 55 57 59
Leg fat (%FM)
M F
Men:
r
= 0.070,
p
= 0.643
Women:
r
= 0.504,
p
≤
0.001
Triglycerides (mmol/l)
3
2
1
0
–1
10 11 12 13 14 15 16 17 18 19 20 21 22 23 24 25 26 27 28 29 30
Gynoid (%FM)
M F
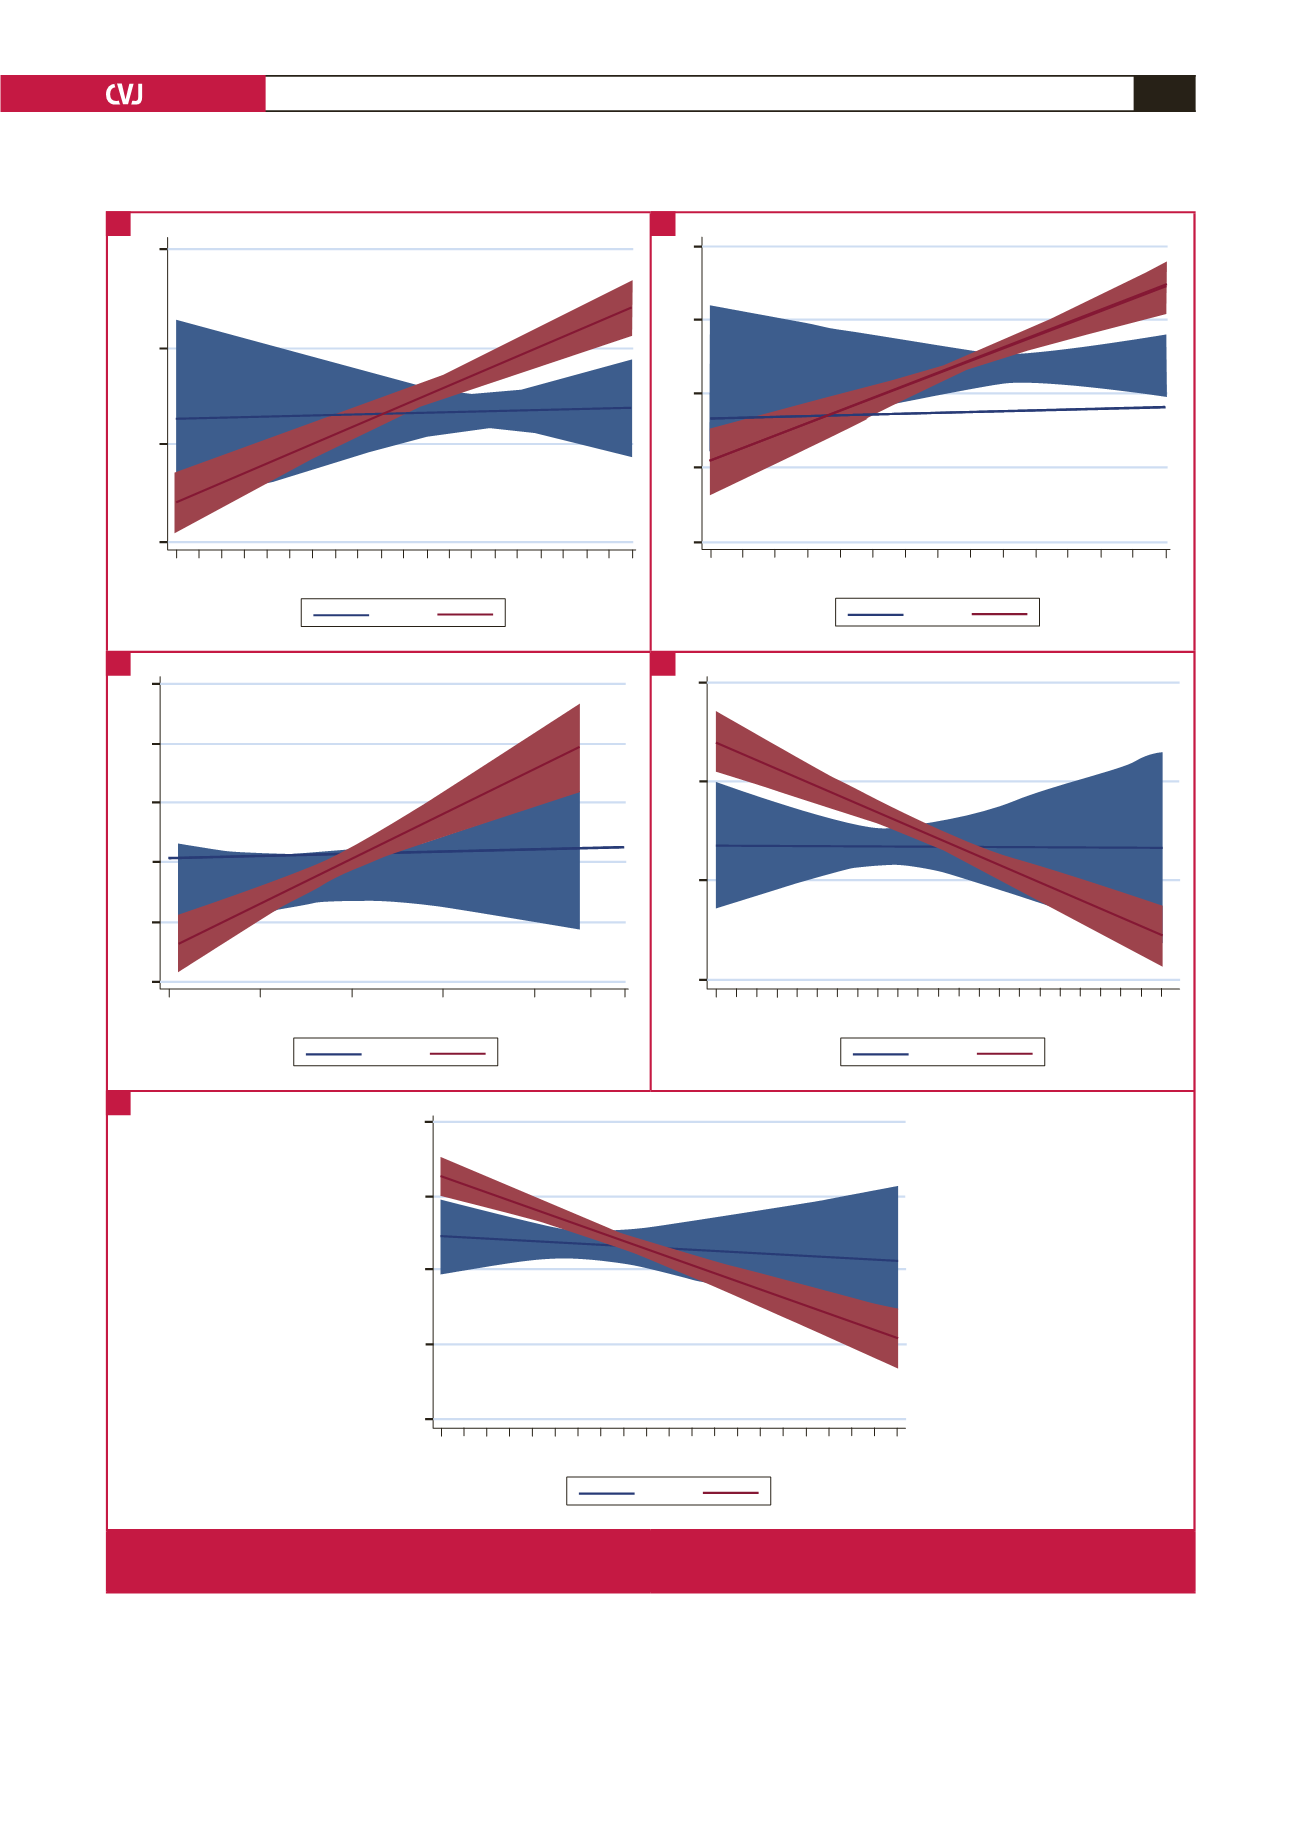
Fig. 2.
Gender-specific associations between serum triglyceride concentrations and trunk % fat mass (%FM) (A), android %FM (B),
visceral adipose tissue area (VAT) (C), leg %FM (D), and gynoid %FM (E).
A
C
E
B
D


