


 30 / 64

CARDIOVASCULAR JOURNAL OF AFRICA • Volume 31, No 3, May/June 2020
138
AFRICA
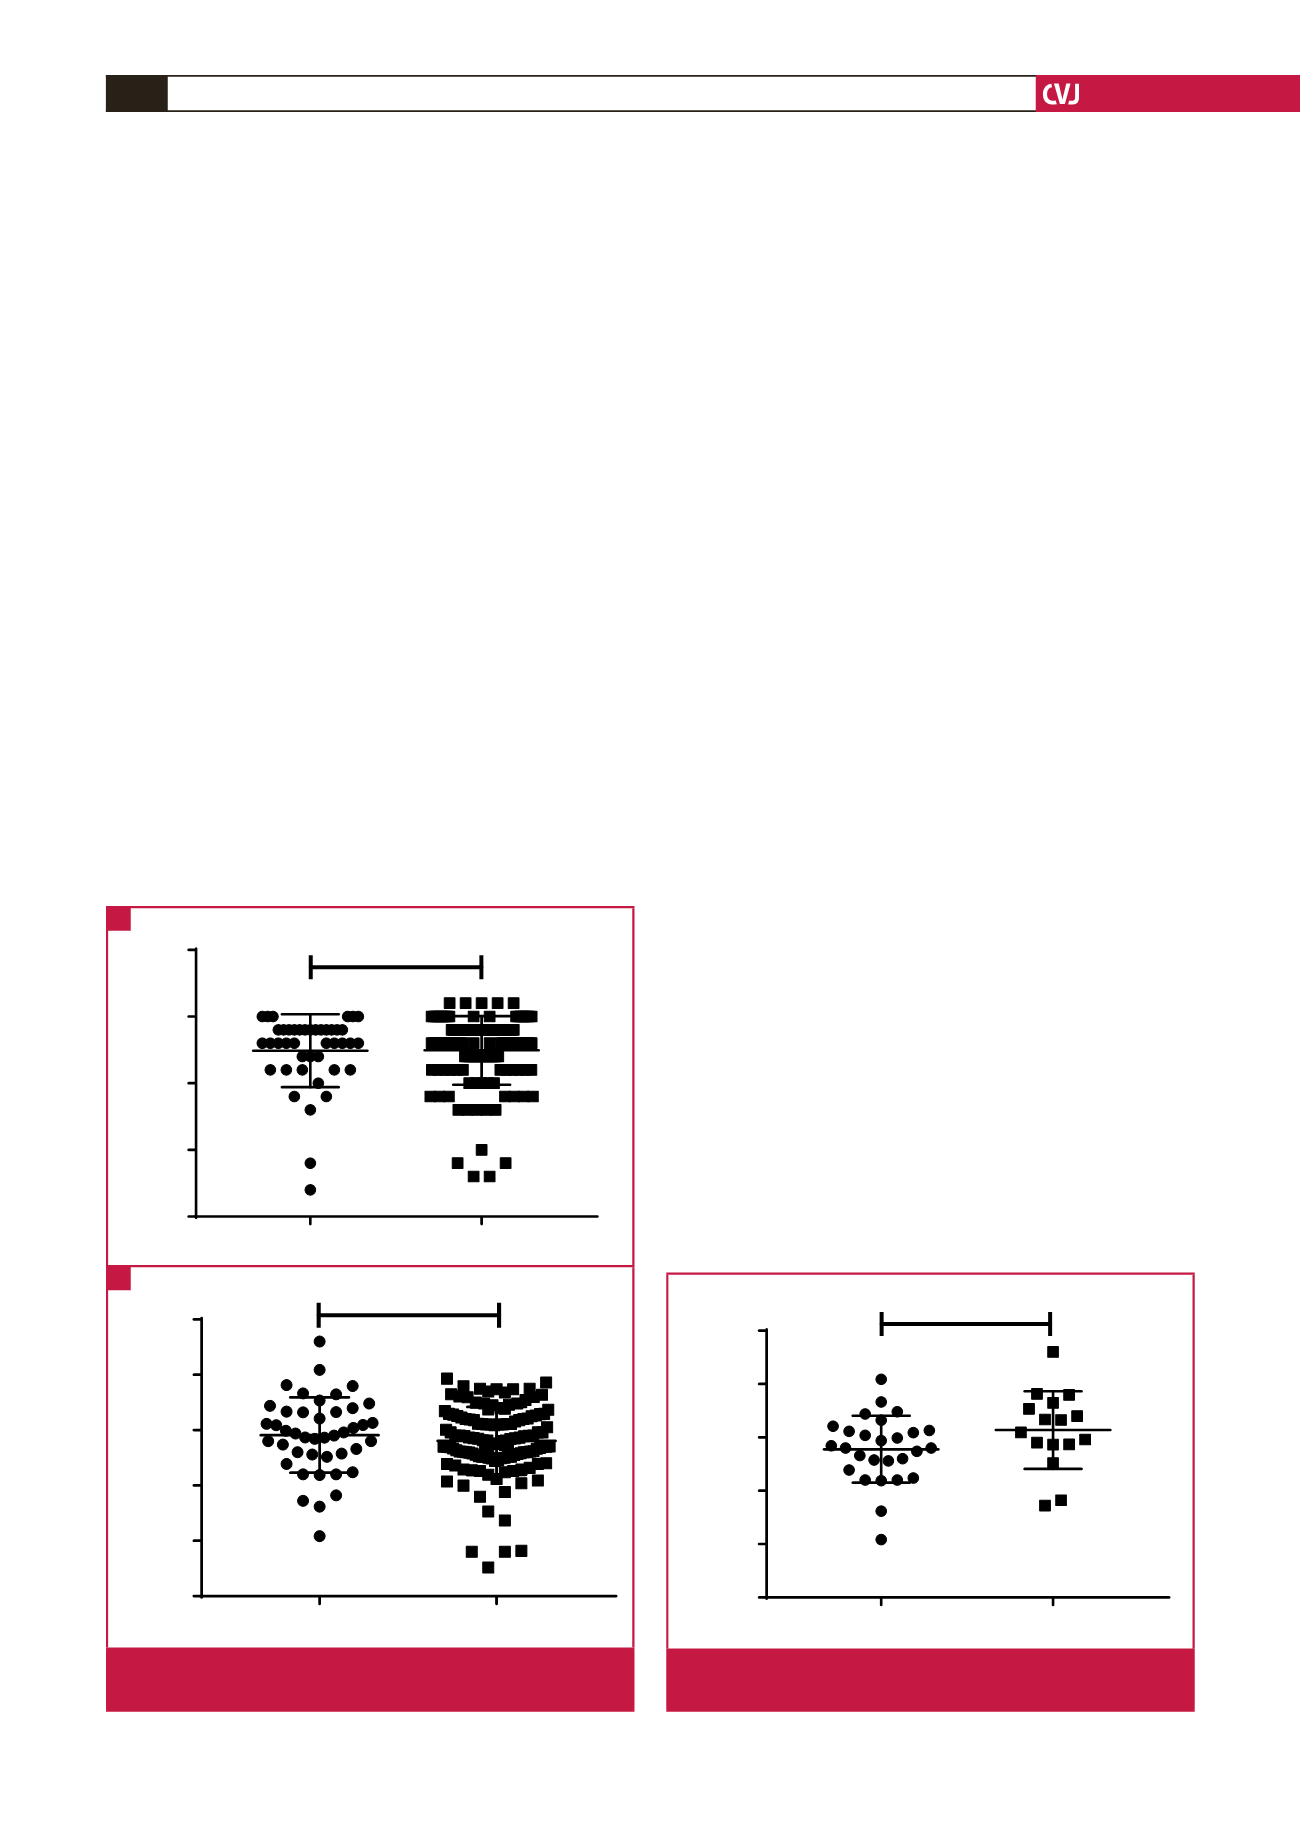
versus carvedilol) with regard to the outcomes of mean GAD
and FBW, we found a non-significant increase (2 728 vs 3 138 g,
p
=
0.094) in FBW of 410 g and a similar GAD (37.5 vs 37.3
weeks,
p
=
0.51) associated with the use of carvedilol (Fig. 3).
Data on BB treatment duration and dosage were available for
all the treated patients. The median (range) dose used was 12.5
mg (6.25–50) for carvedilol and 50 mg (25–100) for atenolol. The
median treatment duration was 98 days with a range of seven
to 273 days. No difference in treatment duration was observed
between carvedilol [122.5 days (7–273)] and atenolol [63 days
(7–273)] (
p
=
0.97). The chi-squared test related to any effects on
foetal outcome was not significant (
p
=
0.3796).
Apart from a significant decrease (
p
=
0.009) in FBW for
valvular SHD pregnancies and an opposing significant increase
(
p
=
0.049) in FBW in the cardiomyopathy subgroup when
exposed to BBs, no differences were noted for FBW and GAD
between the unexposed and BB-exposed groups in the remaining
subgroups.
No significant differences were noted for any adverse foetal
outcomes between the SHD pregnancies exposed to BB and
those who were not exposed. Apgar scores
<
7 occurred in 23
(17%) pregnancies not exposed to BB compared to four (9%)
in the BB group (
p
=
0.33). Preterm births were noted in 32
(24%) pregnancies not exposed to BBs, compared to 11 (26%)
pregnancies in the BB group (
p
=
0.80). LBWs were noted in 28
(21%) pregnancies not exposed to BB, compared to nine (21%)
in the BB group (
p
=
0.87). SGA was documented in 41 (30%)
and 12 (28%) pregnancies of the non-exposed and BB-exposed
groups, respectively (
p
=
0.82). No significant foetal bradycardia
was documented in the hospital records.
When comparing all adverse foetal outcomes between the BB
groups for each SHD subgroup separately, we again found no
significant differences except for SGA (
p
=
0.010) and LBW (
p
=
0.003) pregnancies within the valvular subgroup when exposed
to BB (Table 2).
Severity of maternal SHD at presentation, together with HIV
infection, can directly influence foetal outcome independent
of BB treatment. We therefore compared women with severe
cardiac conditions (NYHA III or IV at presentation) to women
with NYHA I or II, for the occurrence of poor foetal events
such as preterm birth (
<
37 weeks), LBW and Apgar scores
<
7.
Results in Table 3 show no differences according to the severity
of maternal cardiac condition.
In the sameway, HIV impact on gestational period, birthweight
and Apgar scores was analysed using contingency analyses (Table
3). Despite a trend towards a lower birth weight and abnormal
Apgar scores in HIV-positive compared to HIV-negative women,
none of the comparisons was statistically significant.
Correlating the duration of BB treatment with the relative
deviation from expected FBW as a percentage, we found a
non-significant direct correlation (
r
=
0.20;
p
=
0.360; 95% CI:
0.247–0.590) for 24 patients, as seen in Fig. 4.
Discussion
This study, the first of its kind conducted within an African
population, assessed whether the use of BBs in pregnant women
with SHDdecreased FBWand increased adverse foetal outcomes.
Surprisingly, considering our status as a low- to middle-income
country, the largest percentage of SHD pregnancies had CHD
(36.0%) compared to RVD, which predominates in other low- to
middle-income countries.
1
This can be ascribed to an effective
regional referral system, transferring both new and previously
operated CHD cases.
Comparing outcomes between subgroups, we found the
highest mean FBW (2 999 g) within the cardiomyopathy
subgroup, despite registering the lowest gestational age at
delivery in weeks (37.2). Matching these same outcomes to all
B B u s e d
B B n o t u s e d
2 5
3 0
3 5
4 0
4 5
G e s ta tio n a l a g e (w e e k s )
p = 0 .8 4
Gestational age (weeks)
p
=
.84
BB used
BB not used
B B u s e d
B B n o t u s e d
0
1 0 0 0
2 0 0 0
3 0 0 0
4 0 0 0
5 0 0 0
B ir th W e ig h t (g )
p = 0 .3 5
B
Birth weidht (g)
p
=
0.35
BB used
BB not used
Fig. 2.
Comparison between BB groups for mean gestational
age and birth weight.
A
B
Ate n o lo l
C a r v e d ilo l
0
1 0 0 0
2 0 0 0
3 0 0 0
4 0 0 0
5 0 0 0
B ir th W e ig h t (g )
p = .0 9 4
p
=
.094
Birth weight (g)
Atenolol
Carvedilol
Fig. 3.
Comparison between the two types of BB with regard
to mean birth weight.