CARDIOVASCULAR JOURNAL OF AFRICA • Vol 21, No 5, September/October 2010
AFRICA
271
Discussion
The main purpose of this sub-study was to determine whether
different coping styles were associated with MS indicators in
urban African men, as sedentary lifestyles, dietary intake and
psychosocial stress are on the increase.
14
Higher levels of MS
indicators existed in AC participants in relation to their PC coun-
terparts, according to the IDF guidelines (2006).
13
These findings
corroborate the conclusion of the THUSA study, in which urban
AC men were at high risk for development of the MS.
3
In the abovementioned study, the adoption of an AC style was
stated to be a cardiovascular risk factor and this was confirmed
in the SABPA study.
3
Our results revealed a higher prevalence
rate of hypertension of 76% in AC men, compared to 65% in PC
men.
23
Opie (2004) stated that utilising a PC style was associated
with higher prevalence of hypertension as well as strong posi-
tive associations with renal impairment, which is contradictory
to our findings.
11
The results of the PC men however, ultimately
did not show associations with MS indicators, only with BP.
Nonetheless, utilising an AC strategy correlated positively with
SBP, DBP and TPR, together with MS indicators.
3,10
According to the IDF criteria,
13
the AC group showed higher
MS indicators, including increased fasting glucose concen-
trations of 6.09 mmol/l (AC) and 5.40 mmol/l (PC), respec-
tively. Interestingly, in the AC group, 60% of the men had
increased fasting plasma glucose concentrations exceeding the
cut-off points, according to the IDF guidelines (
≥
5.6 mmol/l).
13
Furthermore, 61.5% of the AC men had a WC indicative of
abdominal obesity, and this created great concern because of its
mentioned pathological effects in the development of the MS and
risk of cardiovascular disease.
13,24
Abdominal obesity is the essential prerequisite for diagnosis
of the MS, but no group had values significantly higher than
94 cm.
13
Waist circumference was used to determine abdominal
obesity in this study, as BMI analysis is not indicative of heart
disease, whereas WC has a positive predictive value for iden-
tifying insulin resistance.
25,26
WC was strongly associated with
increased SBP, DBP, triglyceride and fasting glucose levels in
the AC men, showing a trend towards development of the MS
and cardiovascular risk. Conversely, no significant indications
existed in the PC men.
The proposed mechanism for established MS could be that
visceral adiposity is associated with impaired glucose toler-
ance and atherogenic dyslipidaemia, which is a combination of
increased triglyceride and reduced HDL levels as well as LDL
particles.
13,15
As intra-abdominal fat is highly lipolytic and increas-
es fatty acid transport to the liver, a decrease in insulin clearance
is inevitable, causing hyperinsulinaemia.
17
Furthermore, both
visceral obesity and hyperinsulinaemia are associated with
increased sympathetic activity, favouring re-absorption of Na
+
.
17
Increased circulating Na
+
causes vasoconstriction, and hyperten-
sion follows.
15,17
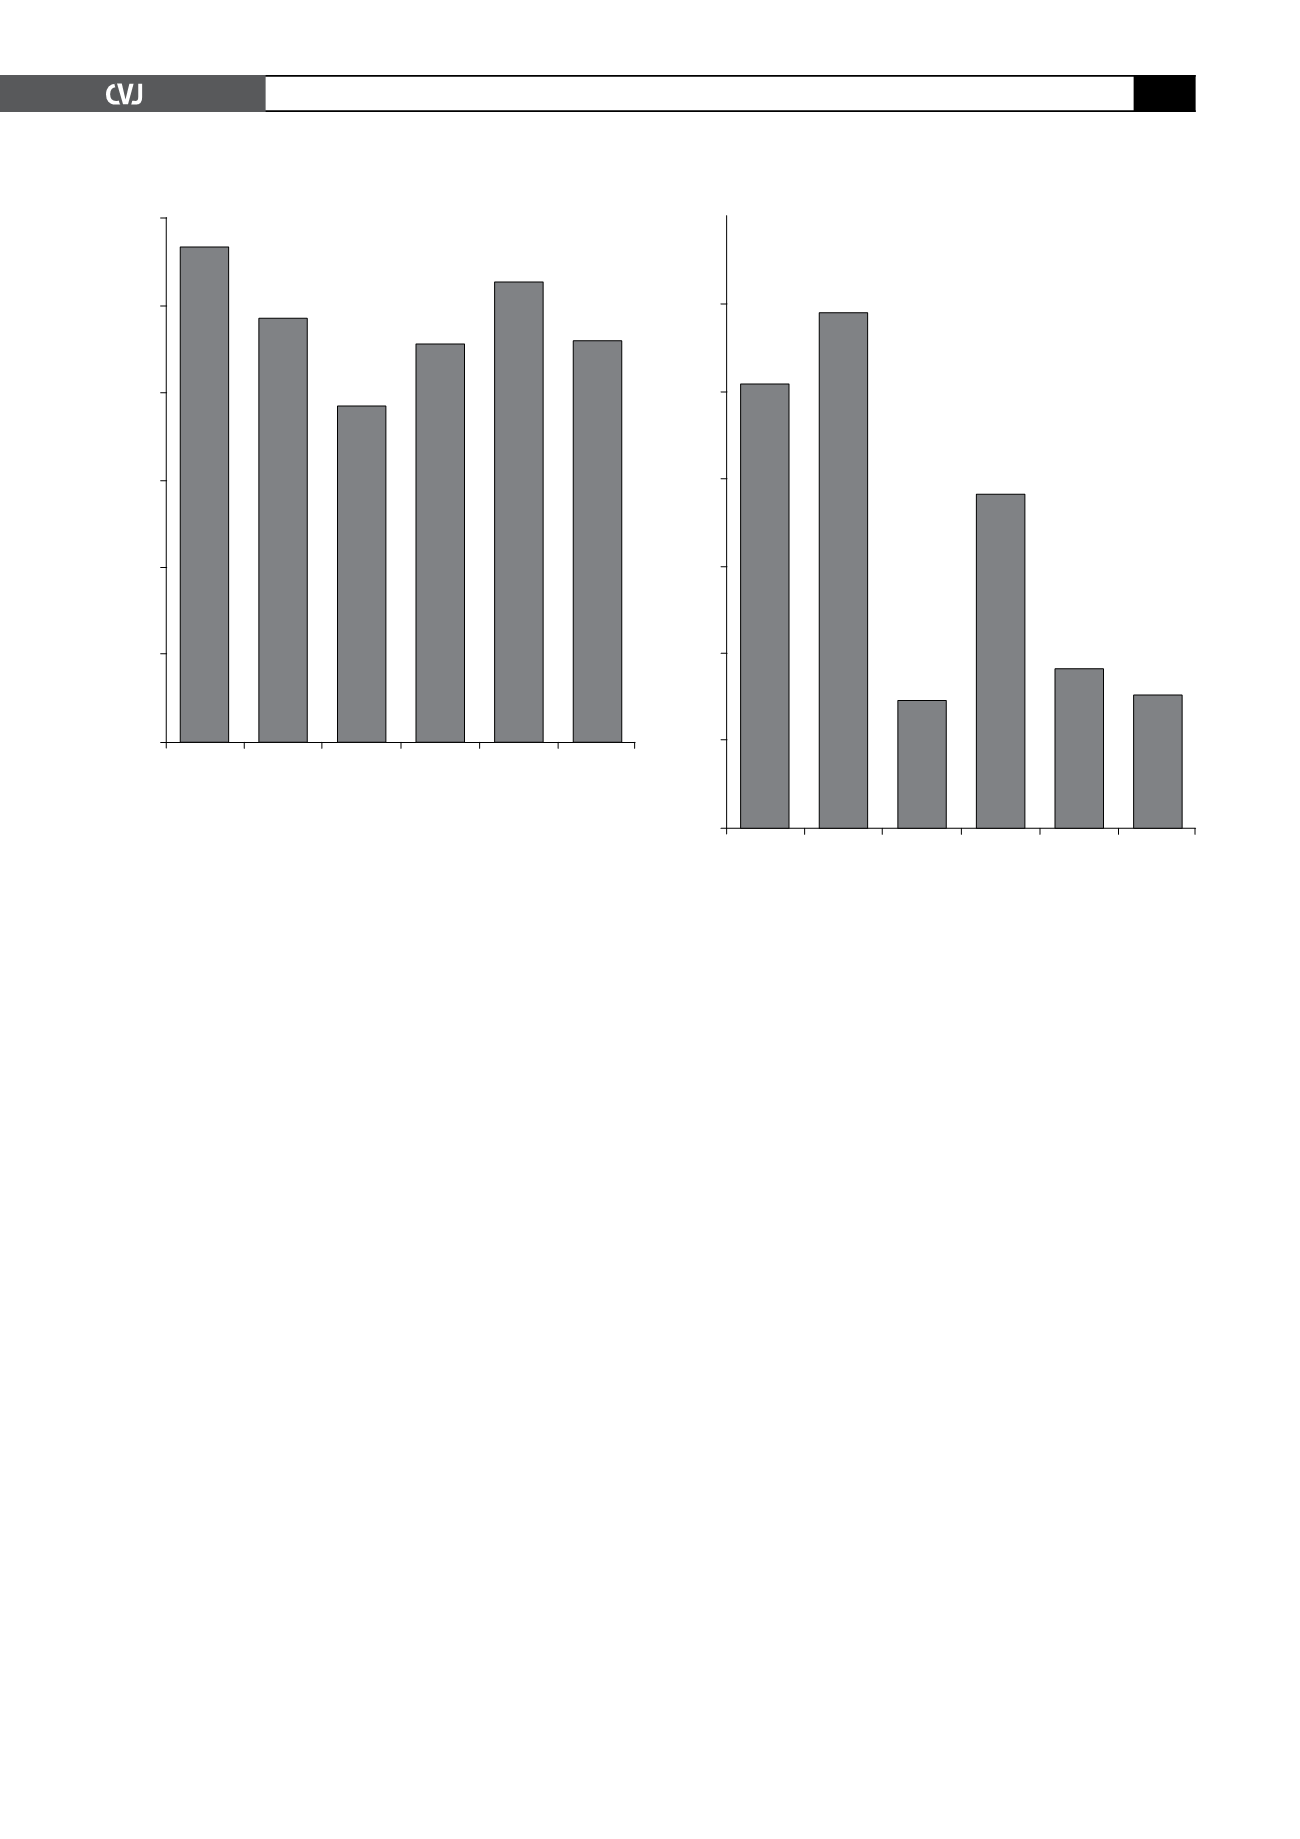
Fig. 1. Partial correlations (
r
-values) between MS and
target end-organ damage indicators (
x
-axis) and waist
circumference (
y
-axis) in active coping African men,
independent of alcohol consumption (IDF guidelines,
2006). SBP
=
systolic blood pressure; DBP
=
diastolic
blood pressure; CIMT
f
=
carotid intima–media thickness
far wall. Significant associations depicted in bold,
r
≥
0.350 and
p
≤
0.05.
0.6
0.5
0.4
0.3
0.2
0.1
0
SBP
(mmHg)
DBP
(mmHg)
Glucose
(mmol/l)
Trigly-
cerides
(mmol/l)
CIMT
f
(mm)
Micro-
albumin-
uria
(
µ
g/l/min)
Waist circumference (cm)
0.567
0.485
0.385
0.456
0.528
0.461
Fig. 2. Partial correlations (
r
-values) between MS and
target end-organ damage indicators (
x
-axis) and waist
circumference (
y
-axis) in active coping African men,
independent of alcohol consumption (IDF guidelines,
2006). SBP
=
systolic blood pressure; DBP
=
diastolic
blood pressure; CIMT
f
=
carotid intima–media thickness
far wall. Significant associations depicted in bold,
r
≥
0.350 and
p
≤
0.05.
0.7
0.6
0.5
0.4
0.3
0.2
0.1
0
SBP
(mmHg)
DBP
(mmHg)
Glucose
(mmol/l)
Trigly-
cerides
(mmol/l)
CIMT
f
(mm)
Micro-
albumin-
uria
(
µ
g/l/min)
Waist circumference (cm)
0.511
0.593
0.149
0.384
0.184
0.154


