CARDIOVASCULAR JOURNAL OF AFRICA • Vol 21, No 5, September/October 2010
276
AFRICA
(intra-observer agreement) was fair, with Lin’s correlation coef-
ficient ranging from 0.92 to 0.99 (
p
=
0.000) across all categories
of radiographs (erect and supine, good, fair and poor quality).
The agreement between observer 1 and observer 2 (inter-
observer agreement) regarding the measured mean SCA and
mean SAD was poor to fair and varied between 0.74 and 0.93
for different combinations of radiograph types. All results were
statistically significant.
Eighty-four of 154 echocardiograms showed left atrial dimen-
sions exceeding 40 mm, and were classified as ‘enlarged’. The
prevalence of enlarged left atrium as determined by echocardiog-
raphy (the gold standard) was therefore 55%.
Logistic regression with either the SCA or the SAD yielded
the model and its performance characteristics are shown in Table
2. Only good-quality radiographs and the observations from
observer 1 were used.
Linearityof the dependent variable (SCAor SAD) for both erect
and supine radiographs in the logit of the independent variable was
assessed using three methods. This was done to confirm that bino-
mial logistic regression was the appropriate method of analysis.
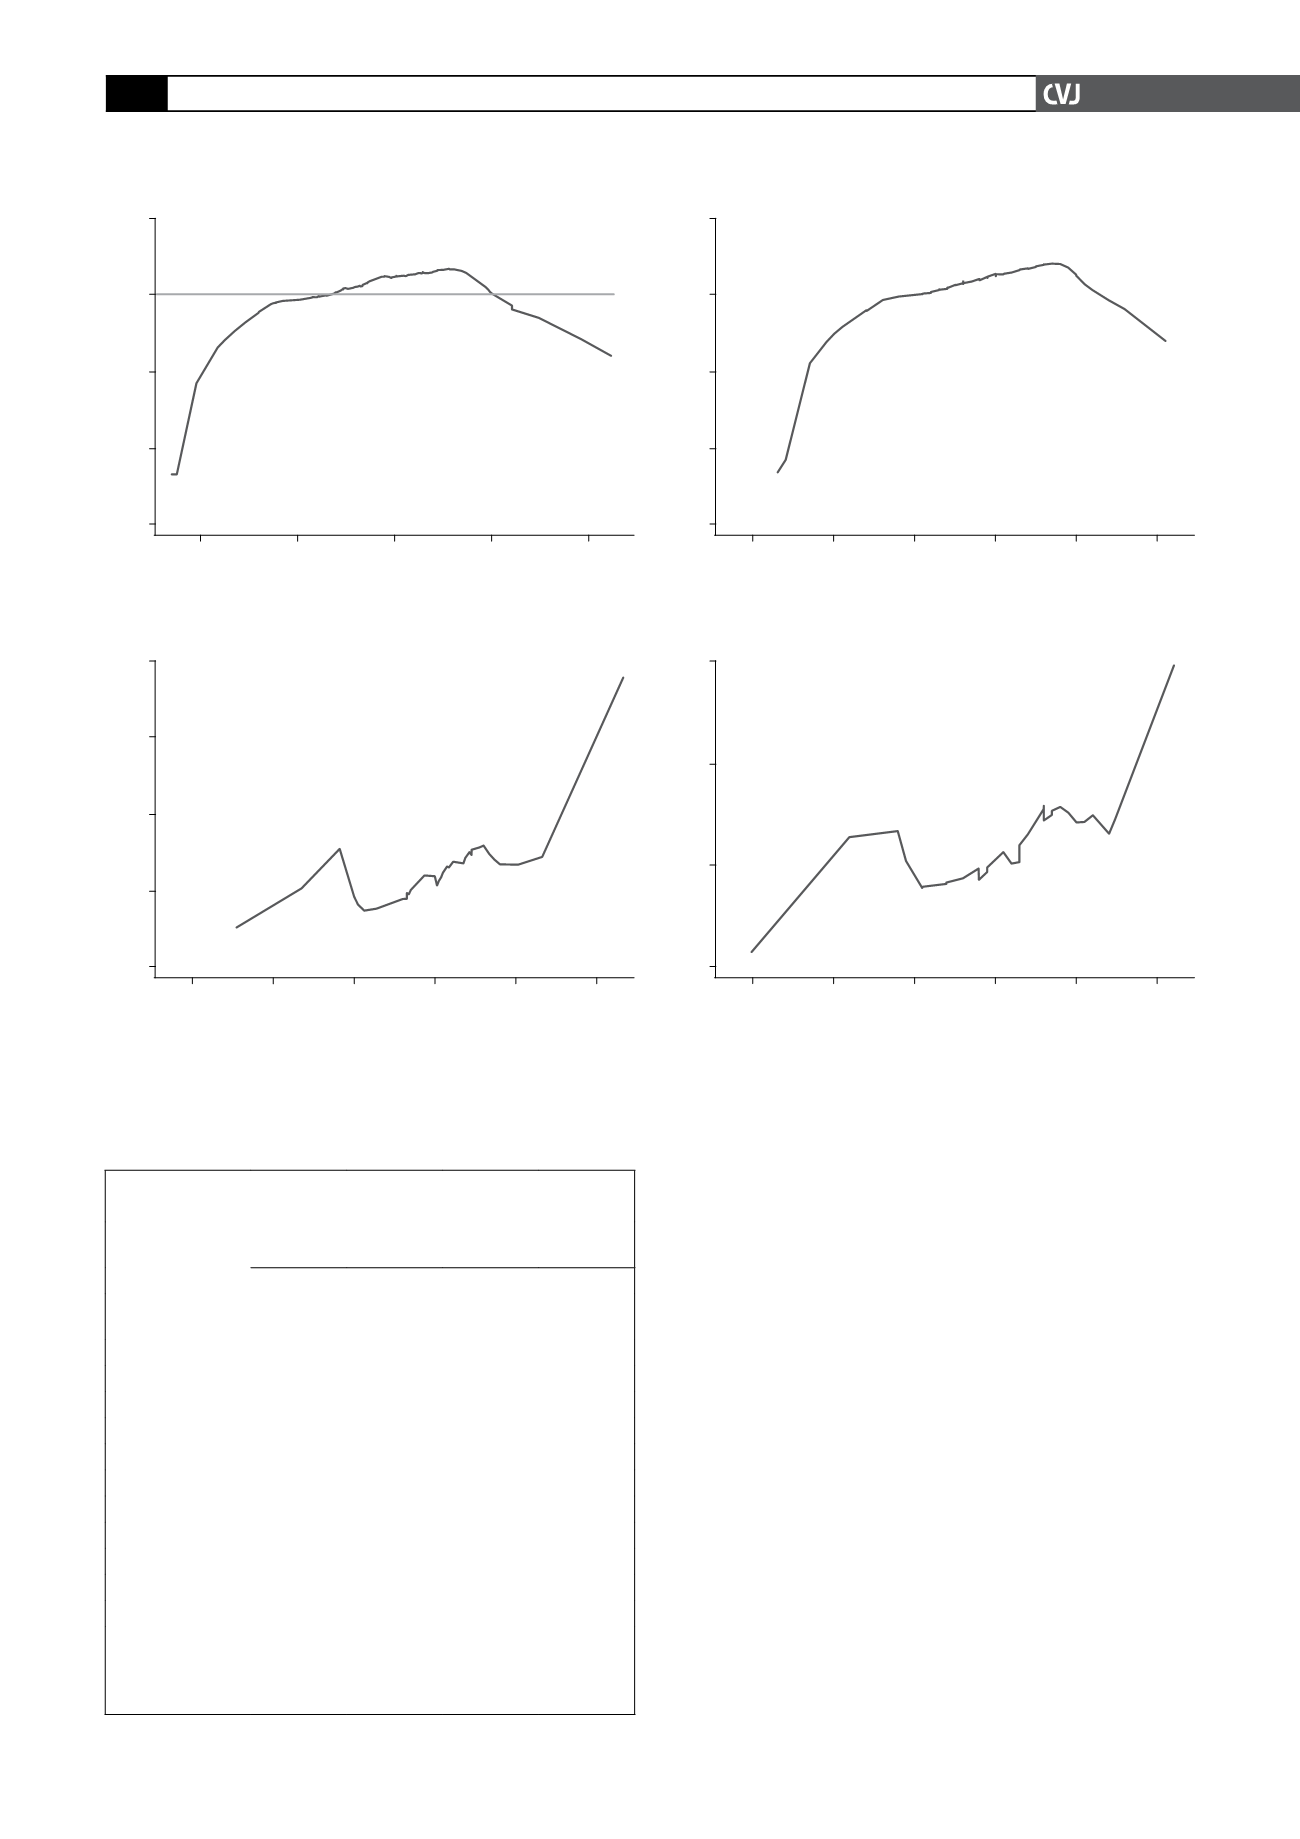
•
Lowess smoothing curves showed that linearity varied over
the interval of the dependent variable. It was present through-
TABLE 2. LOGISTIC REGRESSION MODELWITH
PERFORMANCE CHARACTERISTICS
Good-quality
radiographs
Erect
Supine
Mean of observer 1 SCA SAD SCA SAD
Number of
observations
102
102
37
37
Coefficient (SE)
0.02 (0.01) 0.09 (0.04) 0.03 (0.02) 0.10 (0.07)
LR
χ
2
4.41
5.12
3.16
3.41
OR
1.02
1.09
1.03
1.1
p
-value
0.04
0.02
0.08
0.06
95% CI
–1.05 1.01–1.19 0.99–1.07 0.95–1.27
GOF
0.43
0.15
0.38
0.21
Sensitivity (%)
82.76
82.76
80.00
80.00
Specificity (%)
34.09
36.36
52.94
47.06
PPV (%)
62.34
63.16
66.67
64.00
NPV (%)
60.00
61.54
69.23
66.67
AUC
0.62
0.63
0.62
0.63
SCA: sub-carinal angle, SAD: sub-angle distance, SE: standard error, LR:
likelihood ratio, OR: odds ratio, CI: confidence interval, GOF: goodness-
of-fit, PPV: positive predictive value, NPV: negative predictive value,
AUC: area under the curve.
2
0
–2
–4
–6
40
60
80
100
120
sonarcat
mangle1
Lowess smoother
Logit transformed smooth
bandwidth
=
0.8
A. SCA, erect radiographs
2
0
–2
–4
–6
10
15
20
25
30
35
sonarcat
mhyp1
Lowess smoother
Logit transformed smooth
bandwidth
=
0.8
B. SAD, erect radiographs
3
2
1
0
–1
sonarcat
mangle1
Lowess smoother
Logit transformed smooth
bandwidth
=
0.8
C. SCA, supine radiographs
20
40
60
80
100
120
2
1
0
–1
10
15
20
25
30
35
sonarcat
mhyp1
Lowess smoother
Logit transformed smooth
bandwidth
=
0.8
D. SAD, supine radiographs
Fig. 1. Lowess smoothing curves. Variables: sonarcat enlarged vs non-enlarged left atrium; mangle1: mean SCA as
measured by observer 1; mhyp1: mean SAD as measured by observer 1.


