CARDIOVASCULAR JOURNAL OF AFRICA • Vol 21, No 5, September/October 2010
AFRICA
277
out in the case of erect radiographs, but in the case of supine
radiographs only at the extremes of measurement, corre-
sponding to small and large angles/SADs, respectively. This
is illustrated in Fig. 1.
•
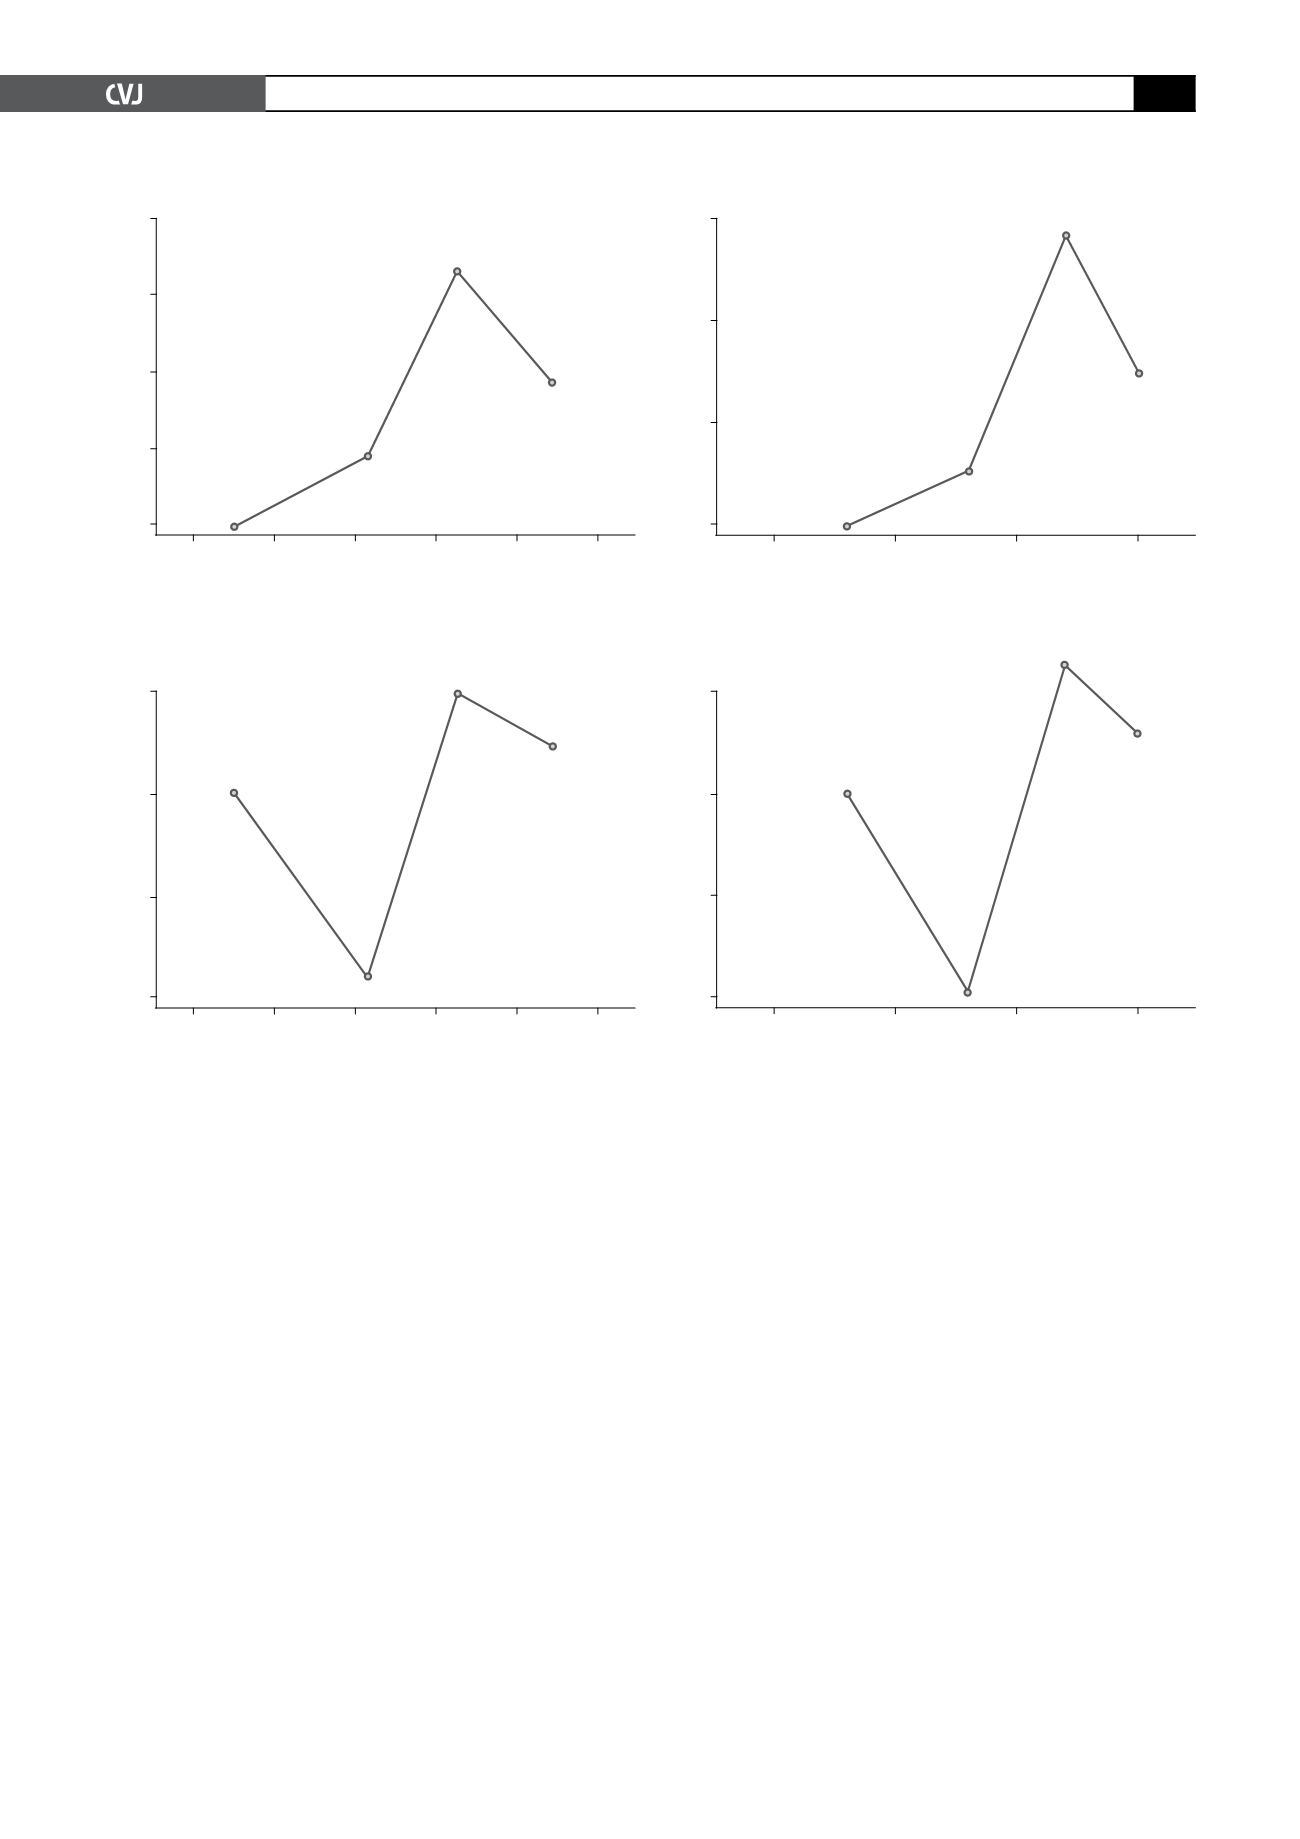
Logistic regression coefficients were plotted against the
approximate quartile midpoints of dependent variables as
shown in Fig. 2. The results of the quartile analysis as plotted
show a definite deviation from linearity in the fourth quartile
throughout all permutations of radiograph types and variables
used in analysis. By contrast, the results suggest linearity in
the logit for both SCA and SAD in the first three quartiles for
erect
radiographs.
•
Fractional polynomial model comparisons showed that the
best non-linear transformations were not significantly differ-
ent from the linear model. Therefore, the fractional polyno-
mial analysis supported treating both variables as linear in
the logit in general, with one exception: a significant
p
-value
of 0.04 for the variable SCA suggested that the fit of the
model might be improved if the variable was transformed by
its inverse square. This in turn suggested that the use of the
transformed variable in the logistic regression analysis might
result in a superior model.
The logistic regression results of the transformed variable, when
compared to the original variable, seemed similar. This similarity
was borne out in the perfect overlap of the ROC curves of the two
models (Fig. 3). The discriminating value of the diagnostic test
did not improve by using a transformed variable.
A diagnostic test is useful if it has both high sensitivity and
specificity. Tests that measure continuous or categorical data
can distinguish between normal and abnormal, based on cut-
off values. These values can in principle be arbitrarily chosen.
In practice, however, those values that offer the best trade off
between sensitivity and specificity are usually employed. Using
the linear model above, cut-off values differentiating between
a non-enlarged and an enlarged left atrium based on chest
radiographs were determined using ROC curves. The results are
shown in Table 3.
Discussion
This study explored the intra- and inter-observer variability of
chest radiograph measurements of left atrial size and aimed to
Fig. 2. Logistic regression coefficients plotted against dependent variables. Variables: mangle1: mean SCA as meas-
ured by observer 1; mhyp1: mean SAD as measured by observer 1.
2
1.5
1
0.5
0
coefficient
mangle1
A. SCA, erect radiographs
50
60
70
80
90
100
1.5
1
0.5
0
15
20
25
30
coefficient
mhyp1
B. SAD, erect radiographs
1
0
–1
–2
coefficient
mangle1
C. SCA, supine radiographs
50
60
70
80
90
100
1
0
–1
–2
coefficient
mhyp1
D. SAD, supine radiographs
15
20
25
30


