CARDIOVASCULAR JOURNAL OF AFRICA • Vol 21, No 5, September/October 2010
278
AFRICA
determine the diagnostic utility of chest radiographs compared
to echocardiography in predicting left atrial size. Data from 159
patients were sampled. Five patients had to be excluded from the
final analysis due to undocumented left atrial size on echocar-
diography.
Intra-observer agreement of measures of left atrial size was
excellent for both observers. Lin’s correlation coefficient ranged
from 0.98 to 0.99 for observer 1 and 0.92 to 0.99 for observer 2
across all categories of radiographs. This implied that the meth-
ods (using the SCA or SAD) were very precise. Inter-observer
agreement between observer 1 and observer 2 ranged between
0.88 and 0.93 across all categories of radiographs except for
supine radiographs in isolation, which yielded coefficients
between 0.74 and 0.88. This underscores the precision (repeat-
ability) of measuring SCAs or SADs.
The linear model obtained using logistic regression demon-
strated that only erect chest radiographs were useful in predict-
ing whether the left atrium was enlarged (all
p
<
0.05), as supine
chest radiographs did not yield statistically significant results,
with
p
-values of 0.08 and 0.06 for SCA and SAD, respectively.
This could be due to the small number of supine radiographs.
Goodness-of-fit results for the above model, varying between
0.15 and 0.43 (all
p
>
0.05), showed that the model was a reason-
able fit for both erect and supine radiographs using either vari-
able (SCA or SAD), which implies that the model effectively
described the outcome variable.
Although the sensitivity of all four categories (erect vs supine
radiographs using SCA vs SAD) was consistently above 80%,
the specificity was poor (
<
53%), so that a normal value would
rule out enlargement of the left atrium. Positive and negative
predictive values (as well as the area under the ROC curve) were
close to 50% (
±
60%) implying that either a positive or negative
result was hardly better than a random guess in predicting left
atrial enlargement. This in effect means that a rule-out strategy
(as suggested by the high sensitivity) using these variables (SCA/
SAD) on their own was not feasible as the model’s ability to
discriminate between enlarged and normal left atria was poor.
The visual representation of the relationship between the
actual left atrial size category and the estimate (SCA and SAD)
as portrayed in the Lowess smoothing curves (Fig. 1) suggests
a linear relationship only at the extremes of SCA (or equivalent
SAD). Between angles of 50° (18 mm) and 110° (32 mm), the
prediction of left atrial enlargement was unreliable, especially for
supine radiographs.
The results of the quartile analysis as plotted in Fig. 2 show a
definite deviation from linearity in the fourth quartile through-
out all permutations of radiograph types and variables used in
the analysis. By contrast, the results suggest linearity in the
logit for both SCA and SAD in the first three quartiles for erect
radiographs.
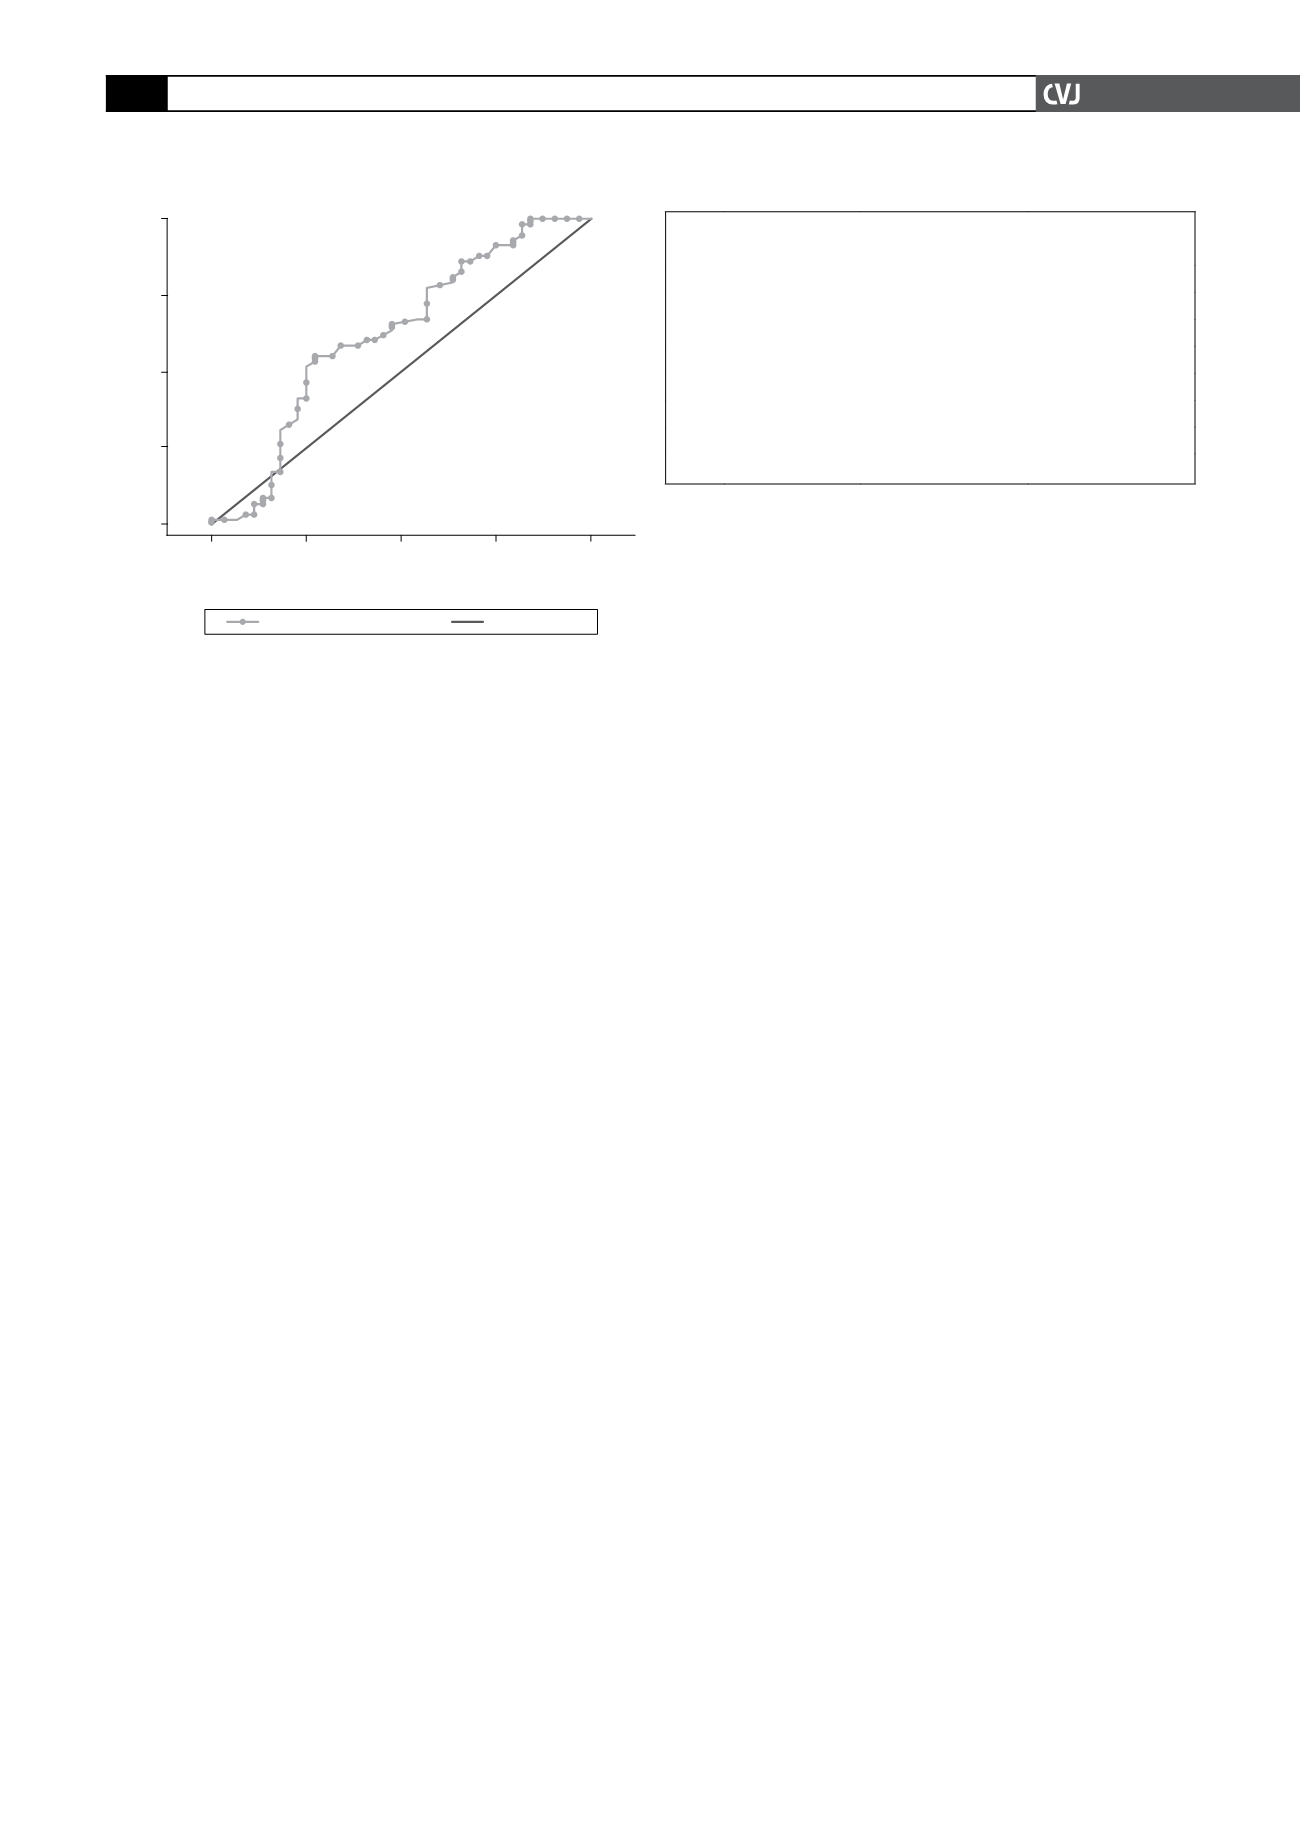
The last measure of linearity in the logit (fractional polynomi-
als) suggested a non-linear model using a transformed SCA (its
inverse square). As this model’s performance did not differ from
the linear one (Fig. 3), it may be concluded that no non-linear
transformation can in fact improve the predictive value of the
model.
The model may therefore be regarded as linear in the logit
of the parameters, using either dependent variable (i.e. SCA
or SAD). This means that logistic regression is the appropriate
method for deriving a prediction rule for left atrial size category
(enlarged/not enlarged) using radiograph-derived left atrial size
estimates.
Optimal cut-off values (Table 3) for the SCA and SAD of both
erect and supine radiographs revealed surprising results. The
commonly used cut-off value for the SCA in clinical practice
thought to indicate an enlarged left atrium is 90°. By contrast,
this study found the cut-off points to be 72° for erect and 84°
for supine films. In addition to this, the SAD measure seemed to
be interchangeable with the SCA measurement throughout the
analysis. Corresponding cut-off values for SAD for erect and
supine films were 24.1 and 26.9 mm, respectively.
There is a considerable degree of overlap in the range of bifur-
cation angles measured in patients with normal and enlarged left
atria, as confirmed by a CT study of tracheal bifurcation angles.
18
Conclusion
Both SCA and SAD can be used interchangeably on erect chest
radiographs of good quality to predict left atrial enlargement with
great precision but poor accuracy. Cut-off values below the tradi-
tionally used 90° were found to predict left atrial enlargement
with improved diagnostic characteristics. The corresponding
SAD appeared to have slightly better diagnostic discriminatory
capability regarding test sensitivity, specificity and correspond-
ing confidence intervals surrounding those measures
The use of chest radiographs in predicting left atrial enlarge-
ment is not recommended due to low sensitivity and specifi-
Fig. 3. ROC curves of logistic regression models using
originals and transformed variables (ROC = receiver
operating characterstic).
1.00
0.75
0.50
0.25
0.00
Sensitivity
1-Specificity
0.00
0.25
0.50
0.75
1.00
q2 ROC area: 0.623
Reference
TABLE 3. CUT-OFFVALUES TO DETERMINE LEFT
ATRIAL ENLARGEMENT
Erect radiographs Supine radiographs
SCA Cut-off value
>
71.72°
>
83.525°
Sensitivity (%) 61.02 (47.44–73.45) 47.62 (25.71–70.22)
Specificity (%) 56.86 (42.25–70.65) 63.16 (38.36–83.71)
SAD Cut-off value
>
24.1 mm
>
26.9 mm
Sensitivity (%) 59.32 (45.75–71.93) 57.14 (34.02–78.18)
Specificity (%) 60.78 (46.11–74.16) 63.16 (38.36–83.71)
SCA: sub-carinal angle, SAD: sub-angle distance.


