CARDIOVASCULAR JOURNAL OF AFRICA • Vol 23, No 1, February 2012
46
AFRICA
Sources of heterogeneity
Fig. 3 shows a Begg’s funnel plot for the visual assessment of
publication bias. A symmetrical pattern was observed, indicat-
ing the absence of publication bias. In addition, both Begg’s
adjusted-rank correlation test and Egger’s regression asymmetry
test showed no evidence of substantial publication bias (
p
=
0.259 for Begg’s test;
p
=
0.159 for Egger’s test).
Meta-regression analyses showed that gender ratio (
p
=
0.112), sample size of the survey (
p
=
0.179), region of the
study (
p
=
0.242) and method of blood pressure measurement
(
p
=
0.942) were not associated with heterogeneity (Table 2).
The only source of heterogeneity across the studies, identified
with meta-regression analyses, was the year of inception of the
survey (
p
=
0.06).
To explore the sources of heterogeneity graphically and
confirm the results of the meta-regression, five subgroups were
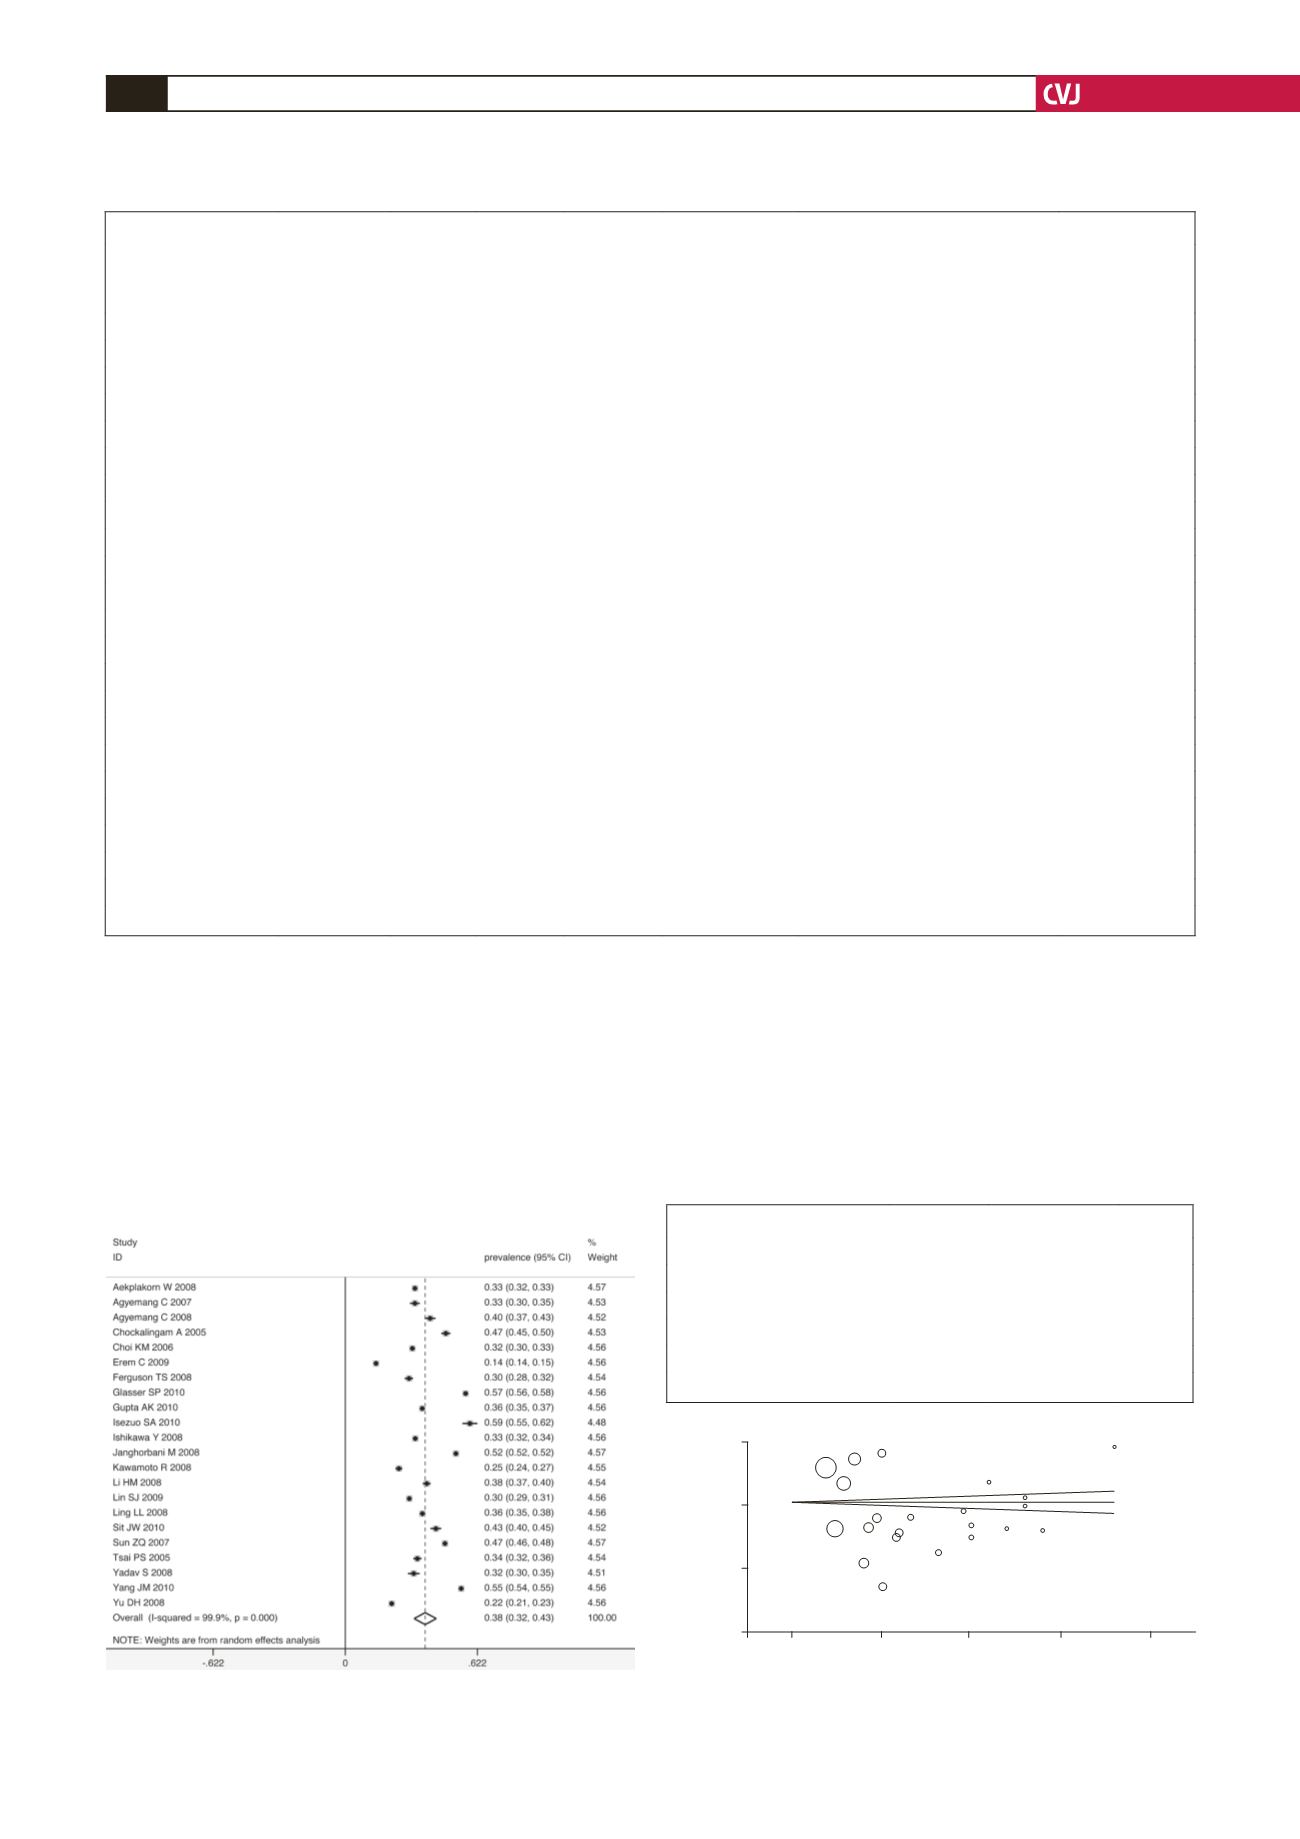
Fig. 2. Pooled prevalence of prehypertension according
to 22 cross-sectional studies.
TABLE 1. CHARACTERISTICS OF 22 CROSS-SECTIONAL STUDIES, REPORTING PREVALENCE OF PREHYPERTENSION
First author,
publication year
Country
Sample
size
Gender
(male %)
Age
(year)
Prevalence of
prehypertension
(%)
Methods of
BP measurement
Criteria for
prehypertension
Aekplakorn 2008
11
China
39290 48.2
≥
15
32.8
mercury sphygmomanometer
JNC7
Agyemang 2007
12
Netherlands
1432 41.1
35–60
32.8
automated digital BP device
JNC7
Agyemang 2008
13
Ghana
1431 45
≥
18
40.0
automated digital BP device
JNC7
Chockalingam 2005
14
India
2007 75
18–86
47.4
mercury sphygmomanometer
JNC7
Choi 2006
15
Korea
6074 43.1
≥
20
31.6
mercury sphygmomanometer
JNC7
Erem 2009
16
Turkey
4809 45.9
≥
20
14.5
aneroid sphygmomanometer
JNC7
Ferguson 2008
17
Jamaica
1972 33.5
15–74
30.0
NA
JNC7
Glasser 2010
18
US
9799 49.8
≥
45
56.7
aneroid sphygmomanometer
JNC7
Gupta 2010
19
US
10380 52.3
≥
20
36.3
mercury sphygmomanometer
JNC7
Isezuo 2010
20
Nigeria
782 52.3
15–65
58.7
automated sphygmomanometer
JNC7
Ishikawa 2008
21
Japan
12048 39.1
18–90
33.0
automated digital BP device
JNC7
Janghorbani 2008
22
Iran
69722 50.3
25–65
52.1
mercury sphygmomanometer
JNC7
Kawamoto 2008
23
Japan
2841 42.5
19–90
25.3
automated digital BP device
JNC7
Li 2008
24
China
2589 41.1
20–84
38.4
mercury sphygmomanometer
JNC7
Lin 2009
25
China
6204 42.7 61.7
±
11.9
30.2
mercury sphygmomanometer
JNC7
Ling 2008
26
China
5272 48.2
≥
15
36.3
mercury sphygmomanometer
JNC7
Sit 2010
27
China
1448 54.4
35–74
42.7
mercury sphygmomanometer
JNC7
Sun 2007
28
China
29970 50.5
35–99
47.0
electric sphygmomanometer
JNC7
Tsai 2005
29
China
2225 46.7
18–96
34.0
standardized sphygmomanometer
JNC7
Yadav 2008
30
India
1112 50.1 49.8
±
11.5
32.3
mercury sphygmomanometer
JNC7
Yang 2010
31
China
20167 38.5
35–74
54.6
mercury sphygmomanometer
JNC7
Yu 2008
32
China
10748 47.0
35–74
21.9
mercury sphygmomanometer
JNC7
NA
=
not available; BP
=
blood pressure.
Fig. 3. Begg’s funnel plot of 22 cross-sectional studies.
0.6
0.4
0.2
0
p
0
0.005
0.01
0.015
0.02
SE of
p
TABLE 2. RESULTS OF THE META-REGRESSION MODEL
Coefficient Standard error
p
-value
Gender (male ratio)
0.0049
0.0029
0.112
Start of survey
0.0106
0.0053
0.06
Sample size
2.06E–06 1.48E–06 0.179
Region
–0.065
0.054
0.242
Method of BP measurement
0.0041
0.0553
0.942
pseudo 95% confidence limits


