CARDIOVASCULAR JOURNAL OF AFRICA • Vol 24, No 5, June 2013
AFRICA
157
LA-GLSRe significantly correlated with LAV
max
(
r
=
0.586,
p
<
0.01), LAV
min
(
r
=
0.530,
p
<
0.01), LAV
p
(
r
=
0.564,
p
<
0.01),
LAAEF (
r
=
0.340,
p
<
0.05), LA total EF (
r
=
0.256,
p
<
0.05)
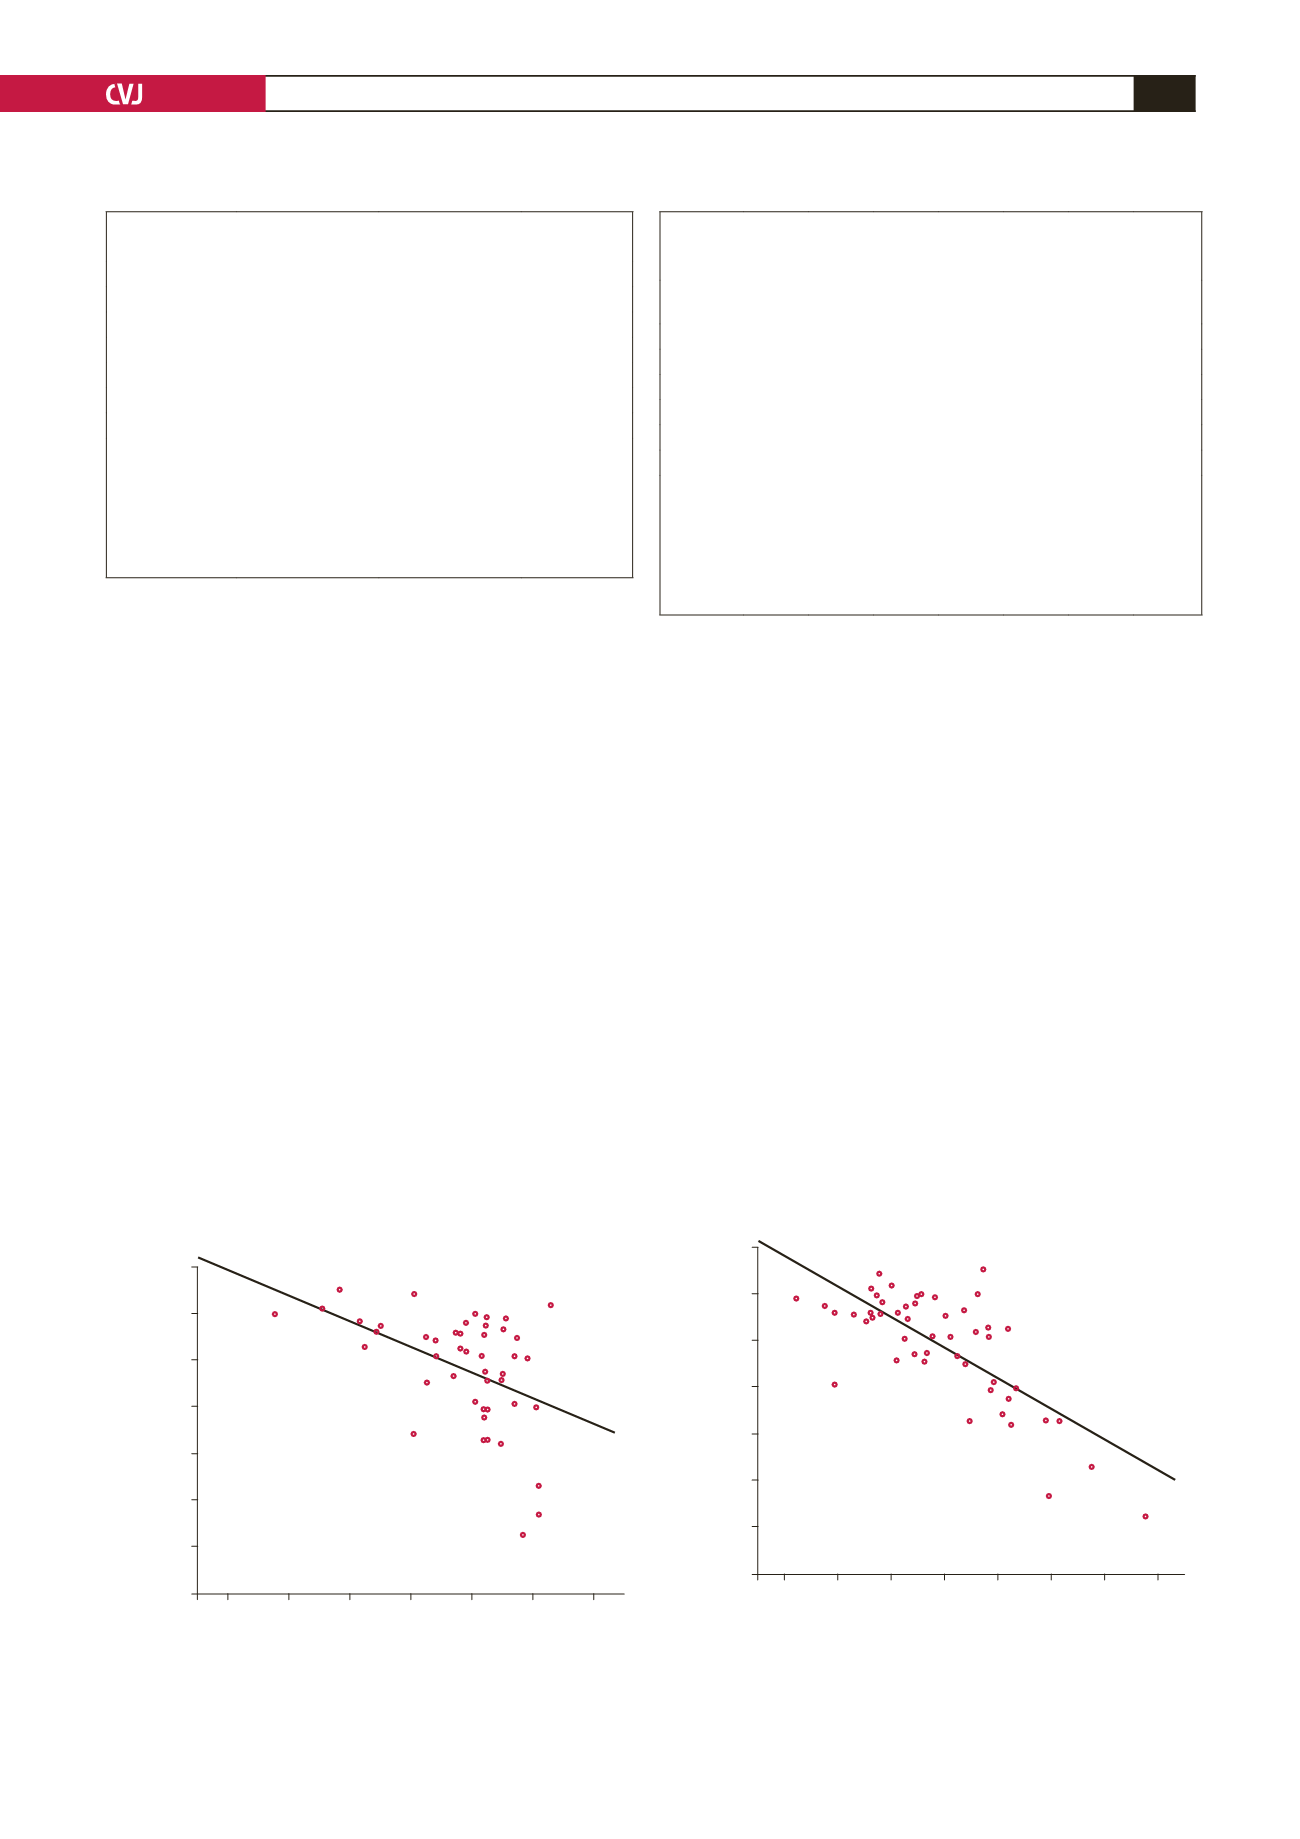
and LVEF (
r
=
–0.477,
p
<
0.001). LA-GLSRa had significant
correlations with the following echocardiographic variables:
LAV
max
(
r
=
0.604,
p
<
0.01), LAV
min
(
r
=
0.615,
p
<
0.01), LAV
p
(
r
=
0.590,
p
<
0.01) and LAPEF (
r
=
–0.298,
p
<
0.05).
LV SR parameters had no significant correlation with the
following LA echocardiographic variables: LAV
max
, LAV
min
,
LAV
p
, LAPEF, LAAEF and LA total EF. In addition, LVEF
was significantly correlated with LA-GLSRs (
r
=
–0.334,
p
<
0.05) and LA-GLSRe (
r
=
–0.477,
p
<
0.001) (Fig. 5), but not
significantly correlated with LA-GLSRa (
r
=
0.339,
p
> 0.05).
LA-GLSRe correlated significantly with LV-GLSRe (
r
=
–0.644,
p
=
0.001) (Fig. 6). However, both LA-GLSRs
and LA-GLSRa showed no such significant correlation with
LV-GLSRs (Fig. 7) and LV-GLSRa (Fig. 8), respectively.
Discussion
After several decades of investigation, current consensus
recommendations state that LA function plays an important role
in optimising overall cardiac function, and the changes in LA
size and function are associated with cardiovascular disease and
are risk factors for atrial fibrillation, stroke and death.
12–14
The
left atrium serves as a blood reservoir during ventricular systole
and a conduit for the passage of blood from the pulmonary
veins into the left ventricle during early and middle ventricular
diastole, as well as a booster pump increasing LV filling during
late diastole.
15
In subjects with normal diastolic function, the
relative contribution of the reservoir, conduit and pump function
of the LA to the filling of the LV is approximately 40, 35 and
25%, respectively.
16
Determined by conventional 2D echocardiography, LA
function has been mainly evaluated using LA volumetric
parameters and LA emptying fraction, such as LA total EF,
LAPEF, and LAAEF, which may be used to evaluate the
reservoir, conduit and booster pump components of LA
function.
6,13
Parameters that evaluate LA function may have
prognostic potential. LA reservoir function may predict the first
atrial fibrillation or flutter episode in elderly subjects, and LA
systolic force may predict cardiovascular events in a population
with a high prevalence of hypertension and diabetes.
17,18
However, all these echocardiographic parameters and others
that evaluate LA function are influenced by LV dynamics and
geometry and/or rely on measurements that are subjected to
TABLE 4. 2D STE PARAMETERS IN PATIENTSWITH
NSTEMI AND THE CONTROLS
Controls (
n
=
36)
NSTEMI (
n
=
46)
p
-value
LA-GLSRs
1.93 ± 0.48
1.59 ± 0.58
0.001
LA-GLSRe
–2.03 ± 0.70
–1.21 ± 0.52
0.001
LA-GLSRa
–2.25 ± 0.67
–1.90 ± 0.77
0.061
LV-GLSRs
–0.92 ± 0.19
–0.80 ± 0.22
0.004
LV-GLSRe
1.17 ± 0.38
0.78 ± 0.27
0.001
LV-GLSRa
0.71 ± 0.22
0.75 ± 0.21
0.062
LA-GLSRs = LA global longitudinal peak positive strain rate during ventricu-
lar systole, LA-GLSRe = LA global longitudinal peak negative strain rate
during early ventricular diastole, LA-GLSRa= LA global longitudinal and
peak negative strain rate during late ventricular diastole, LV-GLSRs = LV
global longitudinal peak systolic strain rate, LV-GLSRe = LV global longitudi-
nal early diastolic strain rate, LV-GLSRa = LV global longitudinal late diastolic
strain rate. Date are expressed as mean ± SD.
TABLE 5. CORRELATION OF GLOBAL LA/LV STRAIN
RATE PARAMETERSWITH LAVOLUMEAND FUNCTION
PARAMETERS IN PATIENTSWITH NSTEMI
Correlation
LAV
max
(ml)
LAV
min
(ml)
LAV
p
(ml)
LAPEF
(%)
LAAEF
(%)
LA total
EF (%)
LVEF
(%)
LA-GLSRs –0.610** –0.668** –0.638** 0.376** –0.303* –0.412* –0.334*
LA-GLSRe 0.586** 0.530** 0.564** –0.270 0.340* 0.256* –0.477**
LA-GLSRa 0.604** 0.615** 0.590** –0.298* 0.262 0.347 0.339
LV-GLSRs –0.136 –0.165 –0.103 0.089 0.072 0.102 0.361*
LV-GLSRe –0.062 –0.014 –0.022 –0.042 –0.030 –0.033 –0.414**
LV-GLSRa 0.162 0.203 0.199 –0.102 –0.067 –0.134 –0.405**
LA-GLSRs = LA global longitudinal peak positive strain rate during ventricular
systole, LA-GLSRe = LA global longitudinal peak negative strain rate during
early ventricular diastole, LA-GLSRa= LA global longitudinal and peak negative
strain rate during late ventricular diastole, LV-GLSRs = LV global longitudinal
peak systolic strain rate, LV-GLSRe = LV global longitudinal early diastolic
strain rate, LV-GLSRa = LV global longitudinal late diastolic strain rate. Date are
expressed as mean ± SD. *
p
< 0.05. **
p
< 0.01.
Fig. 5. Correlation between left ventricular ejection frac-
tion (LVEF) and peak early diastolic strain rate of the left
atrium (LA-GLSRe) in patients with NSTEMI.
0.00
–0.50
–1.00
–1.50
–2.00
–2.50
–3.00
20.00
30.00 40.00 50.00 60.00 70.00 80.00
LA-GLSRe
LVEF
r
=
0.477,
p
<
0.001
Fig. 6. Correlation between peak early diastolic strain rate
of the left ventricle (LV-GLSRe) and peak early diastolic
strain rate of the left atrium (LA-GLSRe) in patients with
NSTEMI.
0.00
–0.50
–1.00
–1.50
–2.00
–2.50
–3.00
0.20
0.40 0.60 0.80 1.00 1.20 1.40 1.60
LA-GLSRe
LV-GLSRe
r
=
–0.644,
p
<
0.001


