CARDIOVASCULAR JOURNAL OF AFRICA • Vol 24, No 7, August 2013
AFRICA
271
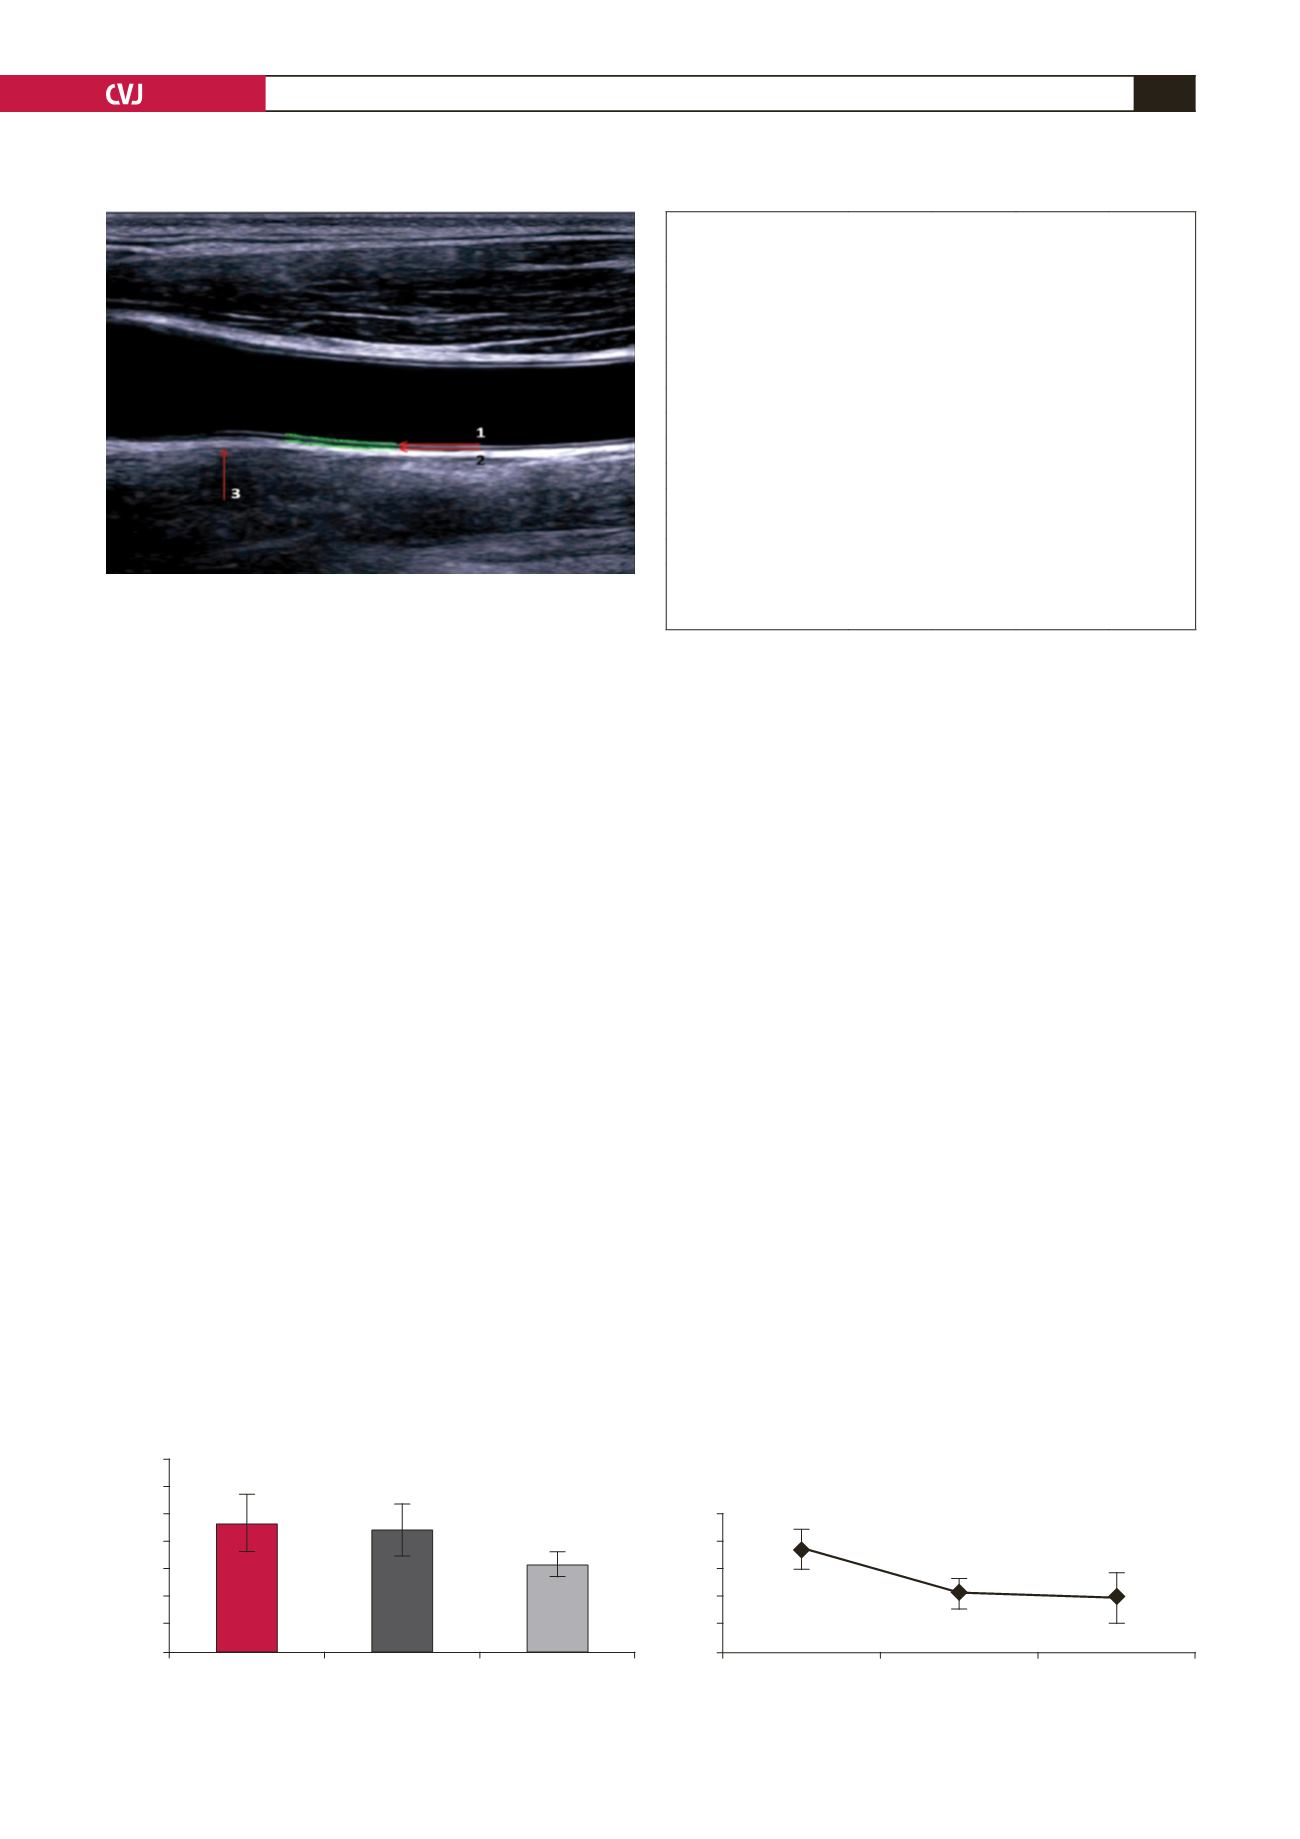
linear array probe. Measurements were carried out at the far wall
(far wall from ultrasound probe) on the right and left common
carotid artery, as recommended by the American Society of
Echocardiography 2008,
20
and the mean value was used in
the study (Fig. 1). Diagnosis of acute coronary syndrome was
established on the recommendations of the European Society of
Cardiology 2011
21
and 2012.
22
Bicycle exercise testing (Cardiax stress ECG, Germany) was
performed to assess exercise functional capacity (expressed
in METs) using the Bruce protocol.
23
Exercise was continued
until the heart rate reached 85% of the estimated maximum
age-predicted target heart rate for each patient, or was symptom
limited. We considered only patients who achieved
≥
5 METs.
Statistical analyses
All data are presented as the mean
±
SD or frequency (%), unless
otherwise stated. The baseline clinical characteristics of the
groups were compared using one-way ANOVA for continuous
variables and the chi-square test for non-continuous variables.
Statistical significance was set at
p
<
0.05.
Results
Baseline clinical characteristics of the study population are
summarised in Table 1. CIMT values were higher in group A
and B, and lower values were found in group C (0.94
±
0.21
mm, 0.89
±
0.19 mm, 0.64
±
0.09 mm, respectively). Statistical
analysis showed significant differences between groups A and C
(
p
<
0.0001), and also between groups B and C (
p
<
0.0001), but
no significant difference was found between groups A and B (
p
>
0.05) (Fig. 2).
Values of hs-CRP were significantly higher in group A (1.87
±
0.36 mg/l) than in group B (1.07
±
0.28 mg/l) and group
C (0.97
±
0.45 mg/l) (
p
<
0.0001). There was no significant
difference between hs-CRP levels in groups B and C (
p
>
0.1)
(Fig. 3).
Discussion
One of the most important results from this study was that CIMT
could predict the presence of coronary artery disease, but it
could not predict coronary events. These data are consistent with
the findings of other authors. Using radionuclide myocardial
perfusion imaging in asymptomatic diabetic subjects, Nair
et
al.
found higher carotid IMT values to be highly predictive of
ischaemia.
24
Yoko
et al.
concluded from their study that the addition of
max-IMT to conventional risk factors substantially improved
the risk stratification for CAD.
25
Baldassarre
et al.
found that a
risk-stratification strategy based on CIMT as an adjunct to the
Framingham risk score was a rational approach to prevention of
cardiovascular disease.
26
However, the results of our study did
not support the above findings that CIMT is a good predictor of
coronary events.
Another important conclusion from our study was that
elevated levels of hs-CRP seemed to coincide more with plaque
destabilisation in cases of acute coronary syndrome, since
hs-CRP levels did not differ significantly in cases with stable
CAD from those of healthy individuals. These data are also not
consistent with data from other authors. Saudi patients with
stable chronic CAD had higher hs-CRP levels compared to
healthy individuals.
27
Khan
et al
. found that patients with chronic
stable angina had elevated levels of hs-CRP.
28
Fig. 1. Measurement of CIMT. 1. Lumen–intima interface,
2. media–adventicia interface.
Fig. 2. Mean CIMT
±
SD in the study groups.
1.4
1.2
1
0.8
0.6
0.4
0.2
0
Group A
Group B
Group C
CIMT (mm)
0.94
0.89
0.64
p
<
0.0001
TABLE 1. BASELINE CLINICAL CHARACTERISTICS
OF THE STUDY POPULATIONS
Group A
Group B
Group C
p
-value
Age (years)
59.3
±
4.5 57.3
±
9.7 56.1
±
7.3 0.129 NS*
Male,
n
(%)
29 (67.44)
32 (64)
23 (46)
0.072 NS**
Hypertension,
n
(%)
18 (41.86)
17 (34)
9 (18)
0.038 S**
Diabetes,
n
(%)
22 (51.16)
22 (44)
11 (22)
0.022 S**
BMI (kg/m
2
)
29.37
±
2.7 28.12
±
2.3 24.6
±
3.1 0.0001 S*
Fasting glucose (mmol/l) 7.3
±
2.15 6.94
±
1.81 5.733
±
2.29 0.001 S*
Total cholesterol (mmol/l) 6.45
±
2.31 6.13
±
2.10 5.13
±
1.48 0.004 S*
LDL-C (mmol/l)
4.53
±
1.27 4.1
±
1.01 2.97
±
1.11 0.0001 S*
HDL-C (mmol/l)
0.95
±
0.32 1.05
±
0.29 1.41
±
0.34 0.0001 S*
Triglycerides (mmol/l)
3.27
±
0.53 3.19
±
1.01 2.014
±
0.85 0.0001 S*
Smokers,
n
(%)
30 (69.77)
31 (62)
23 (46)
0.057 NS**
BMI: body mass index; LDL-C: low-density lipoprotein cholesterol; HDL-C:
high-density lipoprotein cholesterol.
*One-way ANOVA test; **Chi-square test.
Fig. 3. Mean hs-CRP
±
SD in the study groups.
2.5
2
1.5
1
0.5
0
Group A
Group B
Group C
CRP (mg/l)
p
<
0.0001
p
>
0.1
1.87
1.07
0.97


