


 22 / 78

CARDIOVASCULAR JOURNAL OF AFRICA • Volume 26, No 4, July/August 2015
168
AFRICA
was higher in group 1 than in group 2 (–46.21
±
1.55 vs –49.14
±
3.04°C,
p
=
0.016). This difference was caused by higher mean
minimal temperature in the left superior pulmonary vein (Table
3). Mean pre-procedural ACT levels and mean ACT level during
the procedure were comparable between the groups.
Complications related to CA procedures included a major
haematoma in the groin in one patient, transient phrenic nerve
paralysis in four patients, a gastroparesis in seven patients and
a transient ischaemic attack, which had resolved the following
day, in another patient. There was no correlation between
post-procedural hsTn values and the number of trans-septal
punctures or inserted femoral sheaths.
In both groups, no patients showed pathological values for
hsTnI, CK-MB mass, or myoglobin levels at baseline. Post-
procedure blood tests were performed at about 26
±
2.4 hours
after the end of the procedure and pathological values for hsTnI
were recorded in 100% of patients, with a median value of 11.75
±
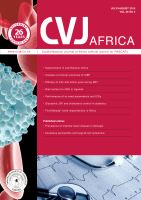
5.25 ng/ml. CK-MB mass was above the cut-off threshold in
54 of 57 patients (94.73%) patients, and myoglobin was above
the cut-off threshold in 17 of 57 (29.82%) patients (Fig. 2). Mean
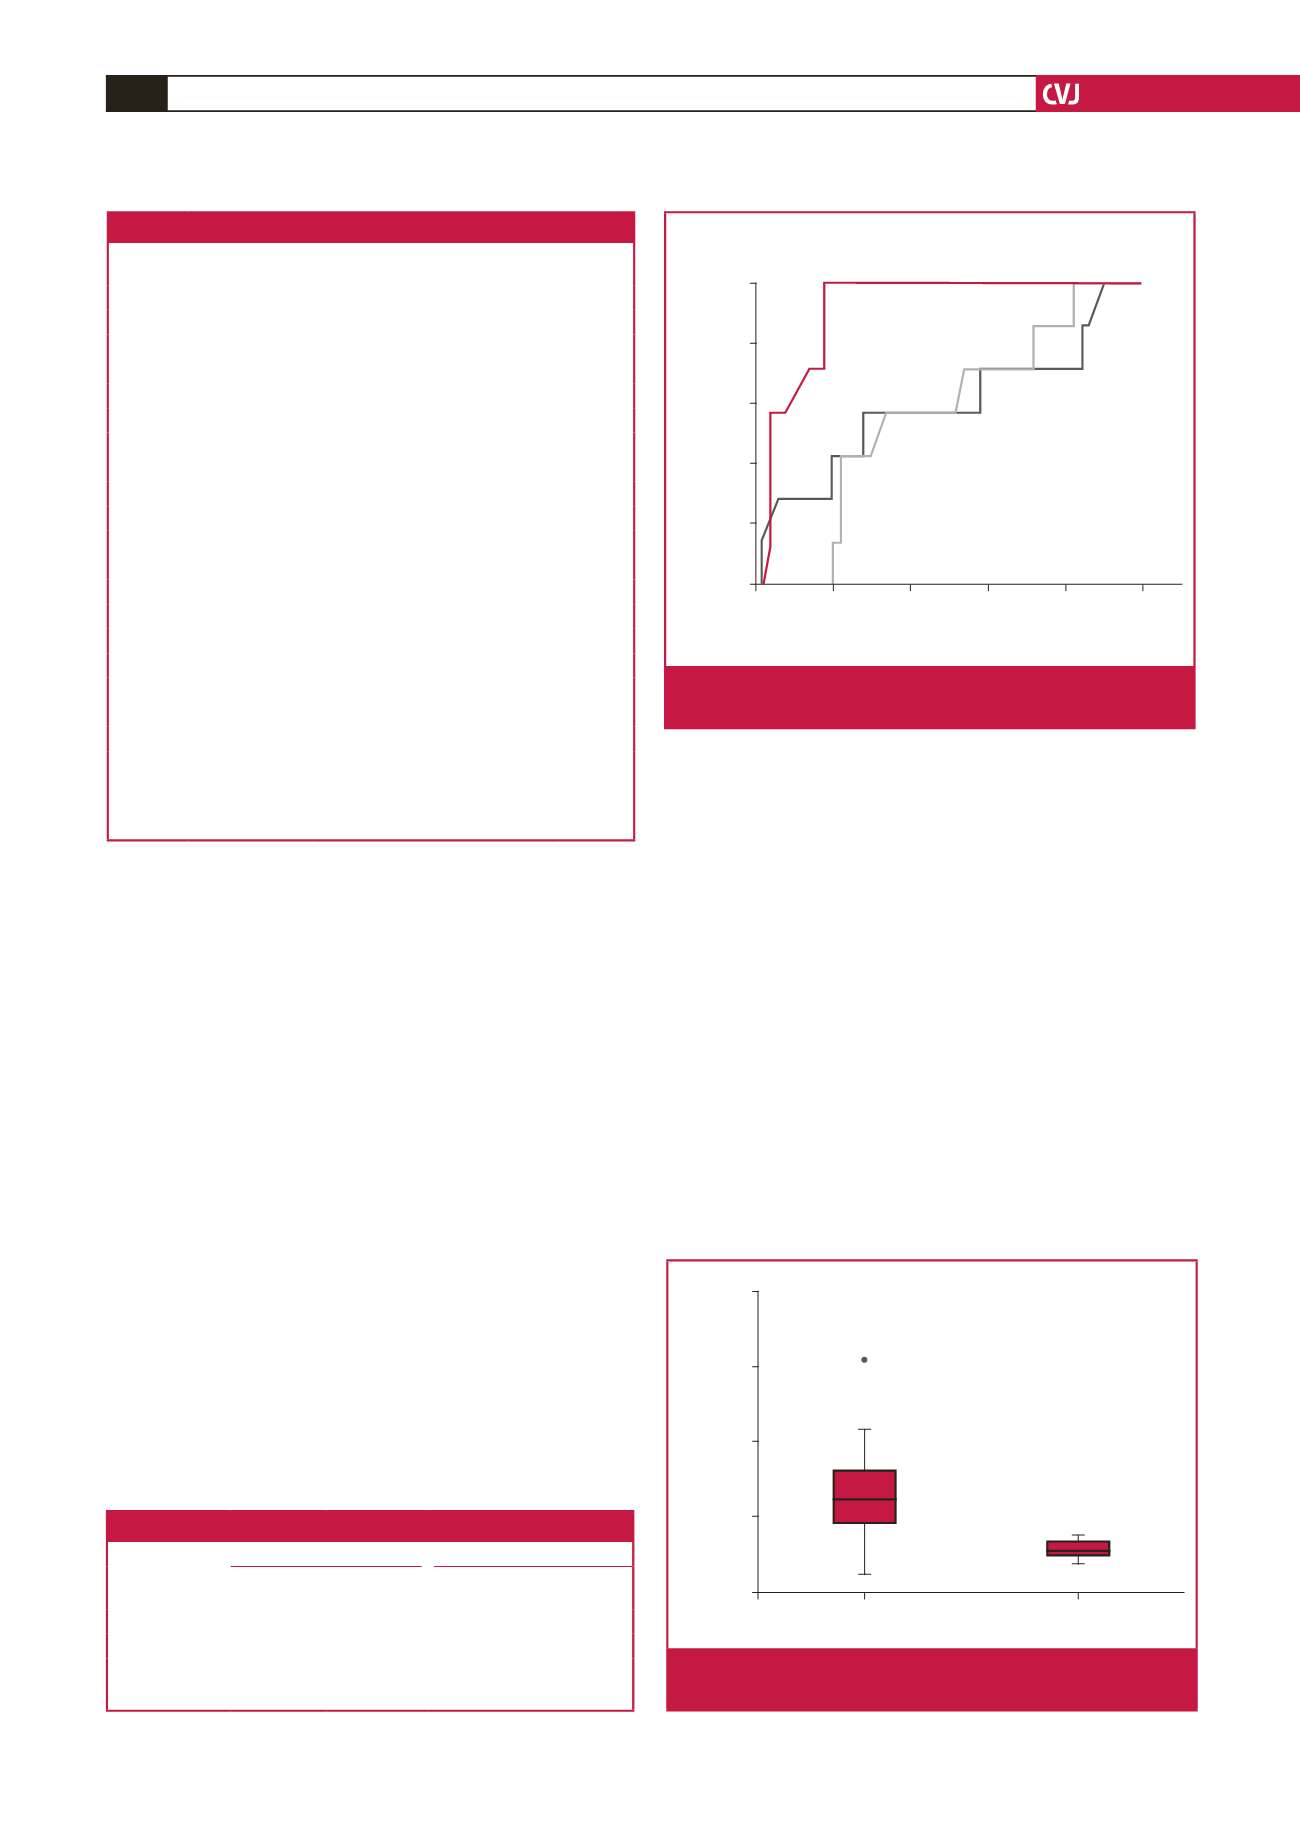
hsTnI levels were significantly lower in group 1 (Table 4, Fig. 3).
Blood levels of CK-MB and myoglobin were slightly higher in
group 1 but these differences did not reach statistical significance
(Table 4).
After multivariate analysis including duration of AF, post-
procedure hsTnI level and left atrial diameter as covariates, only
post-procedure hsTnI level remained a significant predictor for
ablation recurrence. There was no correlation between post-CA
biomarker levels and mean minimal temperature in the PVs.
Both patients with late recurrence underwent redo
electrophysiological studies (EPS) to determine the possible
cause of recurrence. One of these patients underwent CFE
ablation due to persistence of AF after CA. The induction
of AF was achieved by rapid atrial pacing, as mentioned
above. Conventional EPS showed no reconnection of the PVs.
Termination of AF was achieved during CFE ablation at the
anterior wall of the LA in one patient and on the LA roof in
the other.
Discussion
The main findings of this study were that cryo-ablation for
paroxysmal AF resulted in an increase in hsTnI levels. In
Table 3. Procedure-related data (
n
=
57)
Total
(
n
=
57)
Recurrence (
–
)
(
n
=
50)
Recurrence (+)
(
n
=
7)
p
-value
Minimal temperature (°C)
LSPV 50.14
±
3.51 –50.63
±
3.46 –46.71
±
1.11
0.005
LIPV 48.12
±
3.94 –48.46
±
4.04 –45.71
±
1.97
0.084
RSPV 51.45
±
3.67 –51.80
±
3.74 –49.45
±
1.91
0.053
RIPV 45.45
±
3.59 –45.74
±
3.59 –43.42
±
3.10
0.111
Occlusion grade
LSPV 3.82
±
0.38
3.88
±
0.32
3.42
±
0.53
0.764
LIPV 3.77
±
0.42
3.84
±
0.37
3.28
±
0.48
0.605
RSPV 3.98
±
0.13
3.98
±
0.14
3.99
±
0.03
0.408
RIPV 3.80
±
0.39
3.82
±
0.38
3.71
±
0.48
0.143
Freezing duration (min)
LSPV 8.42
±
1.40
8.40
±
1.45
8.57
±
0.97
0.766
LIPV 8.75
±
1.76
8.80
±
1.84
8.42
±
1.13
0.602
RSPV 8.24
±
0.82
8.28
±
0.88
8.80
±
0.96
0.408
RIPV 10.15
±
3.31
9.92
±
3.20
11.85
±
3.80 0.141
Number of applications
LSPV 2.15
±
0.49
2.14
±
0.49
2.28
±
0.48
0.462
LIPV 2.28
±
0.61
2.30
±
0.64
2.14
±
0.37
0.537
RSPV 2.08
±
0.28
2.09
±
0.30
2.13
±
0.55
0.396
RIPV 2.80
±
1.23
2.74
±
1.22
3.28
±
1.25
0.274
LIPV, left inferior pulmonary vein; LSPV, left superior pulmonary vein;
RIPV, right inferior pulmonary vein; RSPV, right superior pulmonary vein.
p
<
0.05.
Table 4. Cardiac biomarker data (
n
=
57)
Pre-procedure (
n
=
57)
Post-procedure (
n
=
57)
Recurrence
(
–
)
Recurrence
(+)
Recurrence
(
–
)
Recurrence
(+)
Troponin
0.01
±
0.01 0.008
±
0.007 12.57
±
5.06 5.90
±
1.42*
Creatine kinase 2.02
±
0.97 2.43
±
1.25 30.36
±
21.37 36.88
±
21.12
Myoglobin
22.27
±
8.91 15.52
±
3.29 72.99
±
20.88 82.14
±
30.31
*
p
<
0.001.
1.0
0.8
0.6
0.4
0.2
0.0
0.0
0.2
0.4
0.6
0.8
1.0
1 – Specificity
Sensitivity
Mg24
Source of the curve
T24
CKMB24
Fig. 2.
Receiver-operator characteristic (ROC) curve analysis
of hsTnI, CK-MB and myoglobin levels.
40.00
30.00
20.00
10.00
0.00
Recurrence (–)
Recurrence (+)
hsTn [ng/ml]
44
Fig. 3.
Comparison of hsTnI levels among patients with and
without recurrence of AF.