


 33 / 78

CARDIOVASCULAR JOURNAL OF AFRICA • Volume 26, No 4, July/August 2015
AFRICA
179
Discussion
The major findings of this study were that (1) there was a high
prevalence of both traditional and non-traditional risk factors
for cardiovascular disease in our patients with CKD, (2) the
majority of patients in this study were in advanced renal failure
(stage 3–5), including more than half in ESRD (111, 51.2%); this
represents two possibilities, including late presentation as well as
limited access to renal replacement therapy, and (3) the severity
and/or frequency of these factors increases with advancing stage
of CKD (declining renal function) (Table 3).
The prevalence of hypertension in this study was similar to the
high prevalence of hypertension in other studies on patients with
CKD. These include a study of 100 patients with CKD at the
University of Nigeria teaching hospital, in which the prevalence
of hypertension was found to be 85.2% at the first nephrology
consultation.
10
A similarly high prevalence of hypertension,
at 72.6%, was found in Albanian patients with CKD.
11
These
findings show that there is a high burden of hypertension in
CKD patients, regardless of the different patient populations
studied. These figures are however four times those of the general
population, where hypertension prevalence was at 20%.
12,13
The available studies from sub-Saharan Africa however cannot
determine with certainty whether hypertension is a cause or effect
of CKD due to various limitations, such as study design, lack of
histological data for participants, as well as late presentation of
patients. In our study, the majority were in stage 4 and 5. This
finding however underscores the importance of appropriate
management of high blood pressure in patients with CKD.
The prevalence of diabetes in this study was similar to the
14.8% prevalence found among CKD patients in a Nigerian
study.
10
The similar prevalence is probably due to similarity of
study settings as well as similarities in characteristics of study
participants (e.g. age, race). However the prevalence of diabetes
in this study was about four times the national prevalence of 4%
in 2006,
14
and 2.9% in 2011.
13
This higher prevalence of diabetes
among patients with CKD compared with the general population
may reflect the significance of diabetes as an aetiological factor
for CKD in Uganda.
The prevalence of smoking in this CKD population was
similar to that of the general population, according to World
Bank figures.
15
Although data from Western countries suggest
that traditional cardiovascular risk factors, including cigarette
smoking, are highly prevalent in CKD populations,
5-7
data for
CKD patients in similar settings are scarce. As the incidence of
a myocardial infarction is increased six-fold in women and three-
Table 1. Demographic and clinical characteristics of study participants
Characteristic
Frequency (
n
=
217) Percentage (%)
Age
<
45 years
124
57.14
Gender
Female
106
48.85
Stage of CKD
1 (GFR ≥ 90 ml/min/m²)
9
4.15
2 (GFR 60–89 ml/min/m²)
12
5.53
3 (GFR 30–59 ml/min/m²)
44
20.28
4 (GFR 15–29 ml/min/m²)
41
18.89
5 (GFR
<
15 ml/min/m²)
111
51.15
Proteinuria
present
184
84.79
HIV antibody test status
Non-reactive
162
74.65
Reactive
32
14.75
Not available
23
10.60
GFR: glomerular filtration rate, HIV: human immunodeficiency virus.
60
50
40
30
20
10
0
LVSF
Arr
IHD
LVH
Target-organ damage
Percentage of total cases
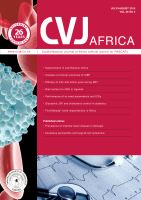
Fig. 3.
Target-organ damage. LVSF, left ventricular systolic
failure; Arr, arrhythmias; IHD, ischaemic heart disease;
LVH, left ventricular hypertrophy.
Table 2.Traditional and non-traditional cardiovascular risk factors
among CKD patients attending Mulago renal clinic
Variable
Frequency
(n
=
217)
Percentage
(%)
Cigarette smoking
25
11.5
Hypertension
196
90.0
Hypertension on treatment
191
88.0
Hypertension under control on treatment
46
24.0
Diabetes mellitus
35
16.2
Body mass index (kg/m²)
<
18.5
20
9.2
18.5–24.9
113
52.1
25–29.9
62
28.6
≥ 30
22
10.1
Non-HDL cholesterol (mg/dl) (3.37 mmol/l)
89
41.0
≥ 130
Haemoglobin concentration (g/dl)
<
11
156
71.9
11–12
30
13.8
> 12
31
14.3
Serum calcium
<
2.2 mmol/l
97
44.7
Serum phosphate > 1.5 mmol/l
85
39.2
HDL: high-density lipoprotein.
Table 3. Variation of cardiovascular risk factors
across the different CKD stages
Variable
CKD stage
p-
value
1
(
n
=
9)
2
(
n
=
12)
3
(
n
=
44)
4
(
n
=
41)
5
(
n
=
111)
Hypertension,
n
(%) 4 (44.4) 8 (66.7) 41 (93.2) 39 (95.1) 99 (89.2)
<
0.001
Obesity,
n
(%)
0 (0.00) 2 (16.7) 3 (6.8) 6 (14.6) 11 (9.9)
0.797
Non-HDL-C
> 130 mg/dl
(3.37 mmol/l),
n
(%)
6 (66.7) 5 (41.7) 21 (47.7) 19 (46.3) 38 (34.2)
0.412
Diabetes,
n
(%)
1 (11.11) 1 (8.33) 8 (18.18) 8 (19.81) 17 (15.32) 0.871
Haemoglobin
<
11 g/dl,
n
(%)
2 (22.2) 4 (33.3) 27 (61.4) 29 (70.7) 94 (84.7)
<
0.001
Calcium
<
2.2 mmol/l,
n
(%)
0 (0.00) 4 (33.3) 11 (25) 17 (41.5) 65 (58.6)
0.004
Phosphate
> 1.5 mmol/l,
n
(%)
1 (11.1) 1 (11.1) 8 (18.2) 11 (26.8) 64 (57.7)
<
0.001
CKD: chronic kidney disease, HDL-C: high-density lipoprotein cholesterol.