


 28 / 92

CARDIOVASCULAR JOURNAL OF AFRICA • Volume 27, No 4, July/August 2016
230
AFRICA
groups were transfected into cells in the same way. Transfections
were performed in triplicate and repeated three times. After
48 hours of incubation, the cells were collected and analysed
for luciferase activity with the Dual-Luciferase Reporter assay
system (Promega).
Nuclear extract preparation
HepG2 cells were propagated in DMEM with 10% FCS under
5% CO
2
at 37°C. Cells were cultured to a density of 1
×
10
7
cells/
ml, according to the manufacturer’s instructions.
HepG2 cells were collected in a 15-ml centrifuge tube and
centrifuged at 500
g
for five minutes at 4°C. The supernatant
was discarded, and the cells were washed three times with 2 ml
of pre-cooled phosphate-buffered saline (PBS). For every 20
μl of cell sedimentation, 200 μl of reagent A were added. The
mixture was vortexed for five seconds, which caused the cell
sedimentation to disperse completely, and placed in an ice bath
for 15 minutes. Then 10 μl of cell plasma protein extraction
reagent B was added to the solution. The mixture was vortexed
for five seconds, placed in an ice bath for one minute, vortexed
again for five seconds, and centrifuged at 16 000
g
for five
minutes at 4°C.
The supernatant was removed and 50 μl of phenylmethyl-
sulfonyl fluoride (PMSF) nuclear protein extraction reagent was
added. The mixture was vortexed for 30 seconds, placed on ice
for two minutes, and vortexed again for 30 seconds. This cycle
was repeated for a total of 30 minutes. After a final centrifuga-
tion at 16 000
g
for 10 minutes at 4°C, the nuclear extract was
drawn into a pre-cooled 1.5-ml centrifuge tube.
Electrophoretic mobility shift analysis (EMSA)
Sequences used for T1 and T1 wild-type and C1 and C2 mutant-
type probe synthesis (Table 1) were labelled and unlabelled
with biotin, respectively. Nuclear cell extracts were incubated
with biotin-labelled double-stranded (ds) oligonucleotide probes
containing the wild-type or mutant AP-2
α
binding sites in the
ApoM promoter (wild-type T1 and mutant-type C1 probes in
Table 1). Competition analysis was performed using the mutant
probe with the AP-2
α
site. Supershifts were performed with
antibodies against AP-2
α
and Sp1 (Abcam).
M 1
2
1000 bp
7000 bp
5000 bp
3000 bp
2000 bp
1500 bp
1000 bp
1561 bp
489 bp
353 bp
242 bp
190 bp
147 bp
110 bp
89 bp
436 bp
352 bp
272 bp
195 bp
164 bp
157 bp
84 bp
M
1
2
3
4
5
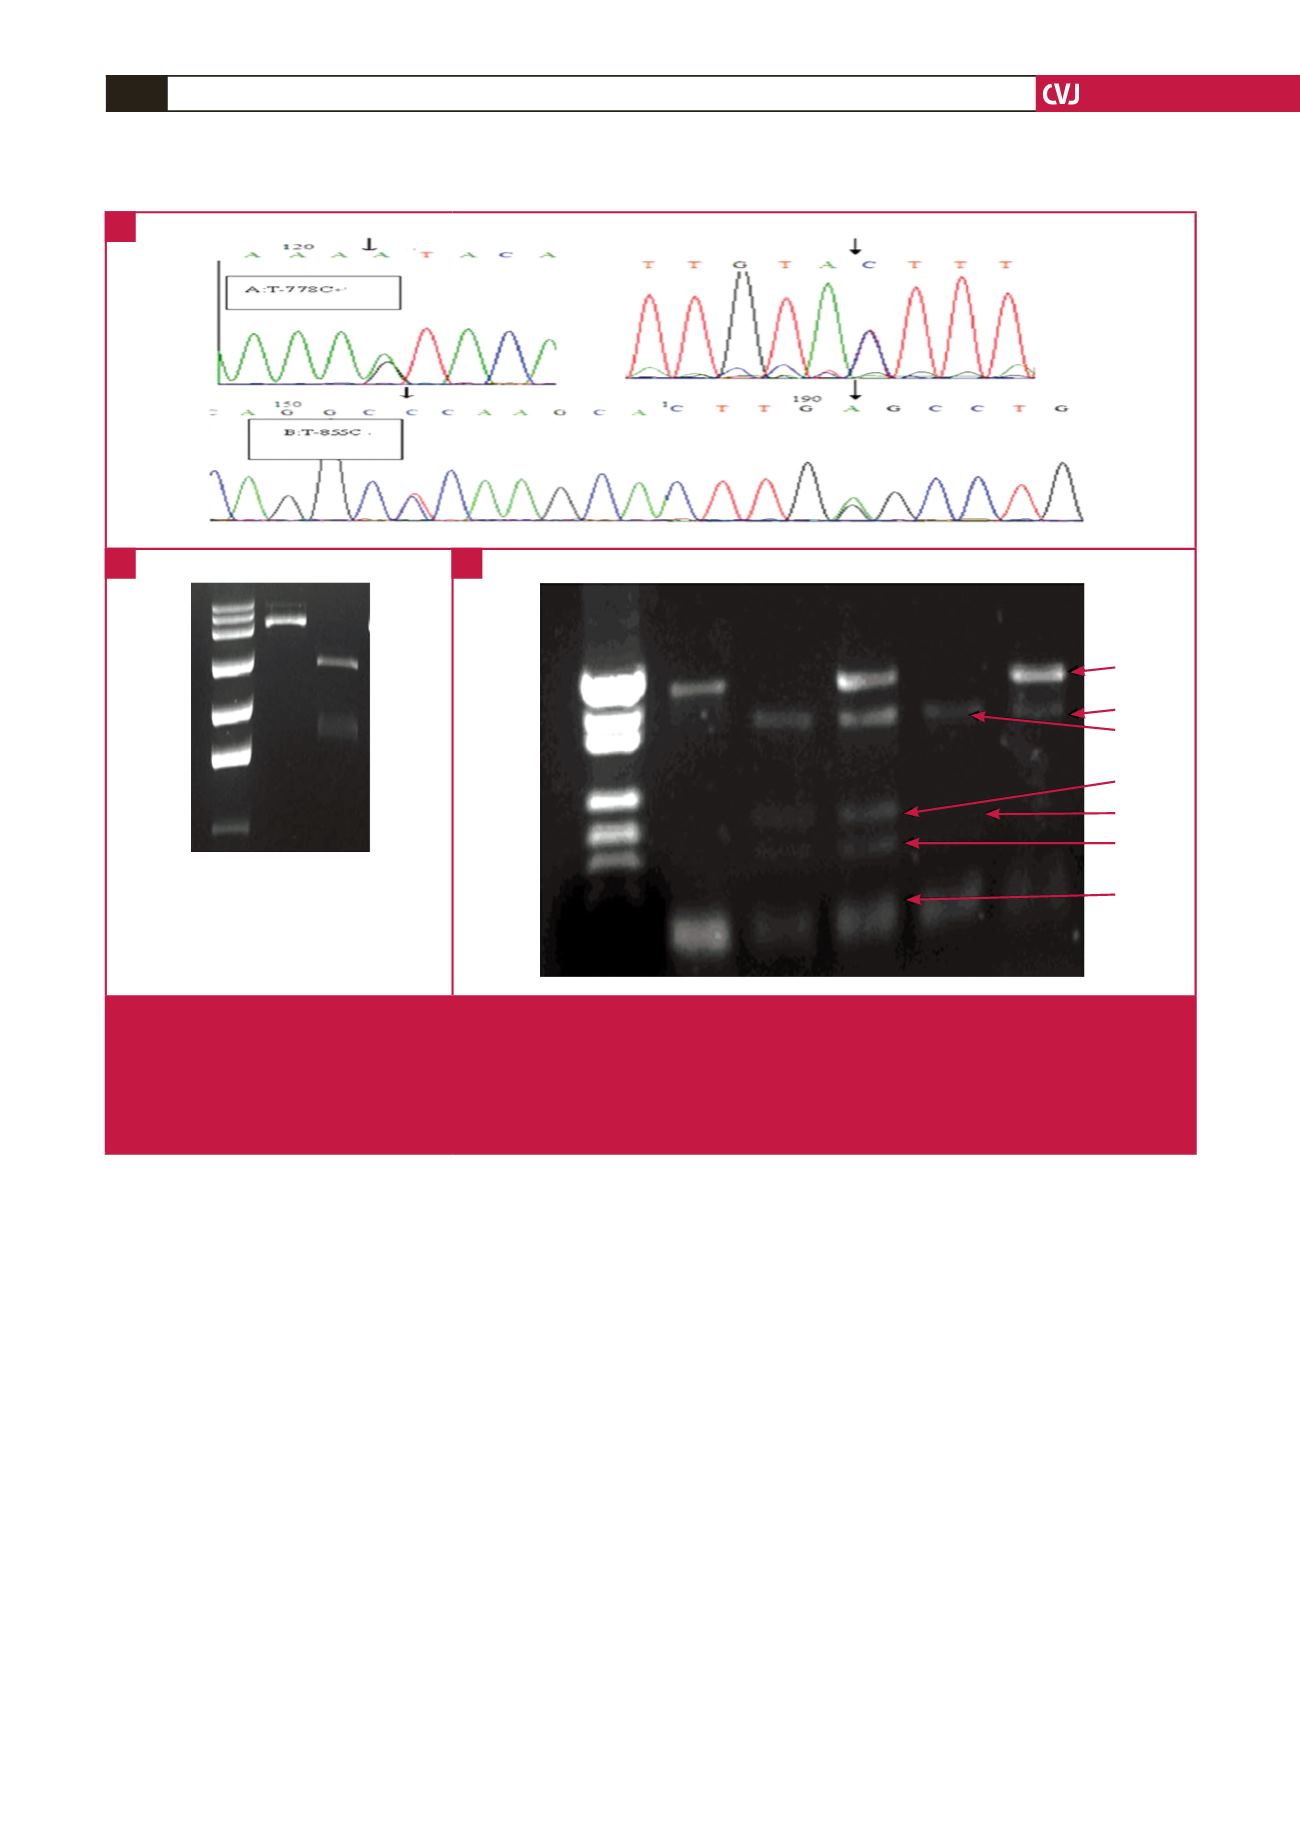
Fig. 1.
PCR-RFLP analysis results for the ApoM T-855/-778C locus. A. Sequencing map for PCR products of the two alleles of
T-855C and T-778C. B. ApoM gene promoter pGL3 reconstruction vector (6379 bp) with restriction enzyme digestion. Lane
M: ladder of molecular size markers; lane 1: vectors without restriction enzyme digestion; and lane 2: vectors with restriction
enzyme digestion. C. Electrophoresis results of SNPs of ApoM proximal promoter and products separated on a 3% agarose
gel and stained with ethidium bromide. Lane M: marker; lane 1: missed cleavages; lane 2: -T855C/C; lane 3: -T855C/TC;
lane 4: T-778C/CC; lane 5: T-778C/TC.
A
B
C