


 33 / 92

CARDIOVASCULAR JOURNAL OF AFRICA • Volume 27, No 4, July/August 2016
AFRICA
235
untreated control cells (
p
<
0.05).
WithAP-2
α
overexpression, the activity levels of cells expressing
the wild-type allele were more reduced than those of cells expressing
the mutant-type (0.25 vs 0.38). The luciferase activity levels of
AP-2
α
overexpressing cells were lower than those of the untreated
cells (
p
<
0.05). Taken together, these results suggest that AP-2
α
was a negative regulatory factor for ApoM expression.
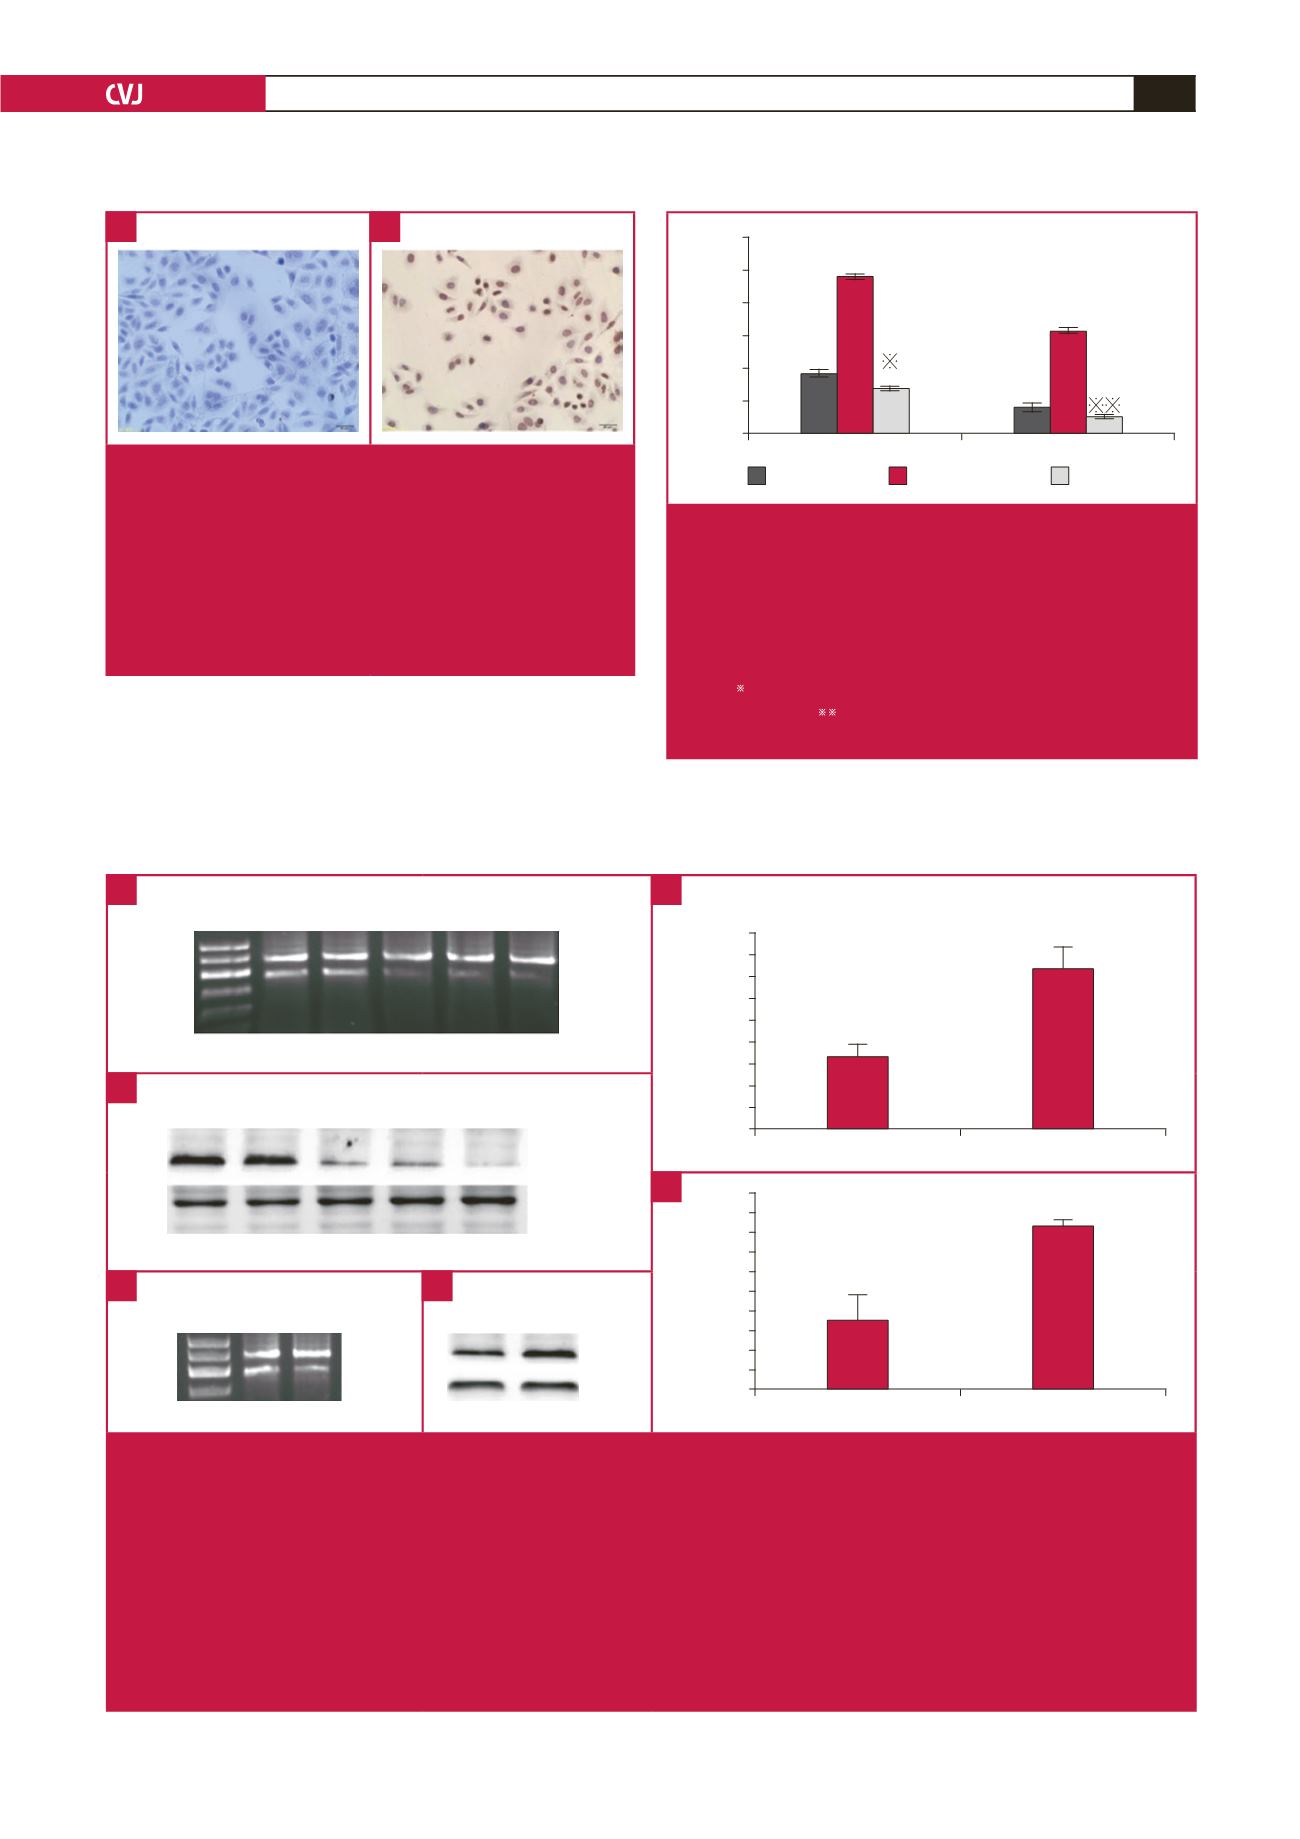
Fig. 6.
Confirmation of EMSA supershift results. To determine
whether unbound Sp1 existed with the Sp1 antibody,
we conducted cell immunohistochemistry experi-
ments. Cells expressing Sp1 were dyed brown–yellow
(B), and negative control cells were stained blue (A).
The results indicated that the extracted nucleoprotein
contained Sp1, and there was no problem in terms
of the Sp1 antibody quality. These results further
confirmed the EMSA supershift results.
A
B
TT
CT
Luciferase activity
6
5
4
3
2
1
0
untreated
AP-2
α
siRNA
GV141-AP-2
α
#
##
Fig. 8.
Relative luciferase activity of the ApoM promoter in
each transfected group. For TT groups: untreated, 1.84
±
0.12; TT + AP-2
α
, 4.83
±
0.08; TT + GV141-AP-2
α
,
1.38
±
0.06; For CT groups: untreated, 0.80
±
0.08;
CT + AP-2
α
, 3.19
±
0.07; CT + GV141-AP-2
α
, 0.51
±
0.05; PGL3-basic was used as a negative control
and PGL3-control as a positive control.
#
p
<
0.05 and
p
<
0.05 vs -855 wild-type untreated group and
##
p
<
0.05 and
p
<
0.05 vs -855 mutant untreated group
by paired
t
-test.
600 bp
500 bp
400 bp
300 bp
GAPDH
AP-2
α
Mark 1
2
3
4
5
empty plasmid
AP-2
α
expression plasmid
AP-2AGAPDH
0.74
0.72
0.70
0.68
0.66
0.64
0.62
0.60
0.58
0.56
AP-2
α
β
-actin
1
2
3
4
5
empty plasmid
AP-2
α
expression plasmid
AP-2AGAPDH
1.02
1.00
0.98
0.96
0.94
0.92
0.90
0.88
0.86
0.84
0.82
600 bp
500 bp
400 bp
300 bp
GAPDH
AP-2
α
M 1
2
1
2
AP-2
α
β
-actin
Fig. 7.
Efficiency of interference in siRNA fragments. After we determined the transfection efficiency of the fluorescent cells to
be
>
70%, we transfected HepG2 cells with siRNAs against AP-2
α
fragments and tested the ability of these fragments to
interfere with AP-2
α
mRNA and protein production (A, B). Interference efficiency was calculated using the Tanon GIS image
analysis system. The interference efficiencies of fragments 1, 2, and 3 on the AP-2
α
mRNA levels were 86.06, 83.68 and
92.43%, respectively, and on the AP-2
α
protein levels were 61.15, 58.42 and 79.59%, respectively. Because the interference
efficiency of fragment 3 was the highest, we selected this fragment for use in the subsequent experiments. Interference and
overexpression of AP-2
α
in HepG2 cells. RT-PCR (A) and Western blot analyses (B) of AP-2
α
mRNA and protein expression
levels, respectively, in HepG2 cells treated with three interference fragments for 72 hours. AP-2
α
overexpression in HepG2
cells resulted in elevated AP-2
α
RNA (C), and protein expression levels (D), compared to controls. AP-2
α
mRNA vs GAPDH
mRNA: 0.63
±
0.01 vs 0.71
±
0.02 (E); AP-2
α
protein vs
β
-actin protein: 0.89
±
0.03 vs 0.99
±
0.01 (F), both
p
<
0.05 by
paired
t
-test.
E
A
B
C
D
F