


 47 / 92

CARDIOVASCULAR JOURNAL OF AFRICA • Volume 27, No 4, July/August 2016
AFRICA
249
and in the final model the strongest predictor among them was
log-RDW.
We know that increased body fat mass can lead to
atherosclerotic vascular diseases.
2
If there is no evidence of
cardiovascular disease or disorders such as hypertension,
hyperlipidaemia and diabetes in overweight or obese individuals,
they are not treated with medication, but lifestyle changes are
suggested.
16
Despite this, cardiovascular events appear more
frequently in the obese population than in individuals with a
lower BMI.
1
In this study, we speculated that RDW may be used to
determine persons at high risk for atherosclerosis among
obese and overweight individuals without overt cardiovascular
disorders. Thus individuals who are prone to atherosclerosis
could more easily be identified using RDW and more closely
followed up.
RDW, which is usually overlooked and almost only used in
the differential diagnosis of anaemia in daily practice, is typically
raised in some cardiac and non-cardiac conditions, such as
coronary artery disease, peripheral artery disease, acute coronary
syndromes, heart failure, malnutrition, neoplastic metastases to
bone marrow and inflammatory bowel disease.
7,17-19
RDW generally reflects ineffective red cell production or their
increased rate of destruction. However, it has been demonstrated
that oxidative stress and chronic inflammation also cause elevated
RDW. By destruction of the erythrocytes, haemolytic conditions
lead to elevation of RDW, and impaired erythropoiesis,
haemoglobinopathies, folic acid or cyanocobalamin deficiency,
and iron deficiency also cause raised RDW.
19,20
On the other hand, inflammatory cytokines have an effect on
iron metabolism and the production or activity of erythropoietin.
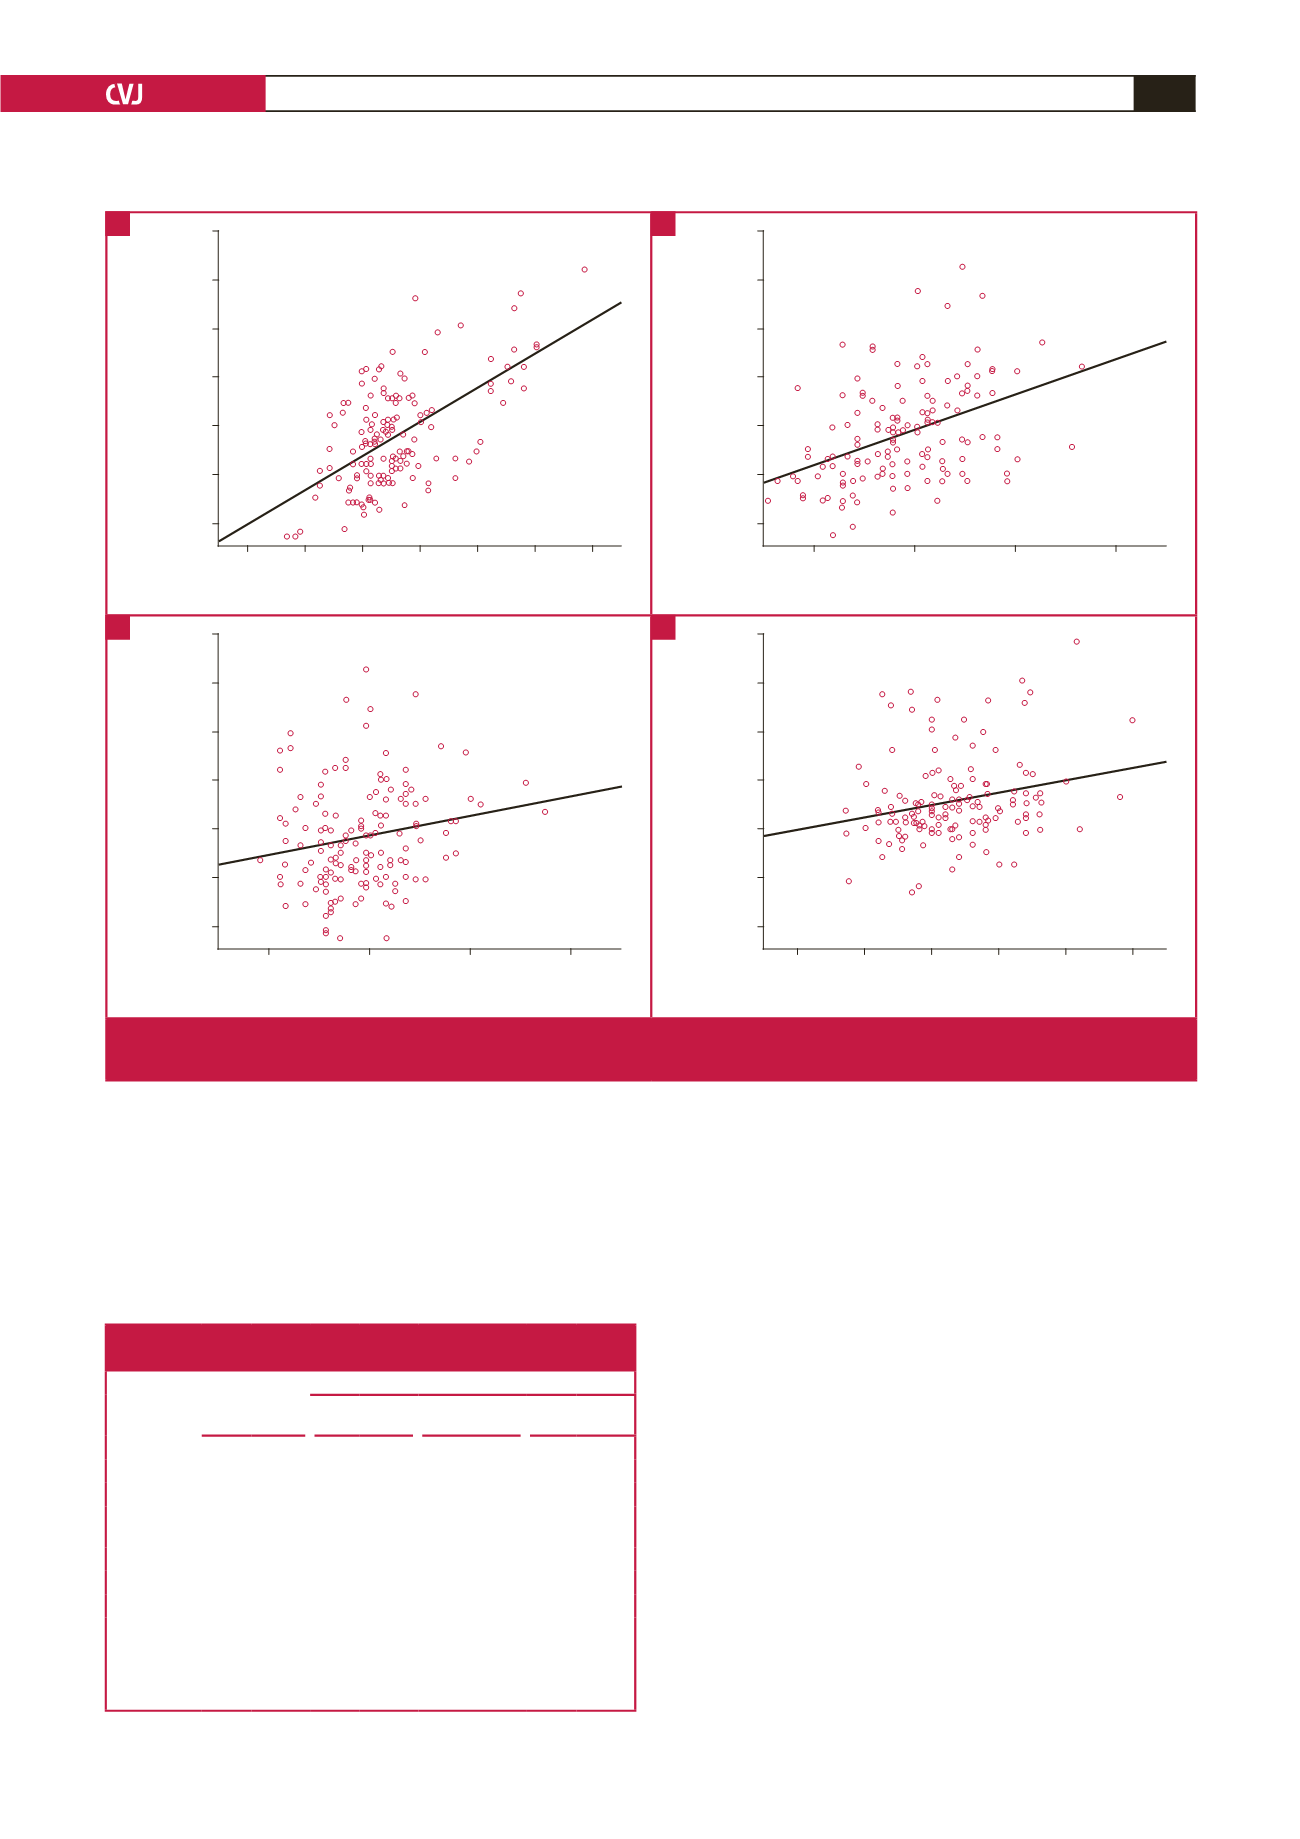
Table 3. Bivariate correlations and regression analyses
(stepwise) of aortic PWV with related parameters
Parameters
Bivariate
correlation
Stepwise regression analyses
Model I
(
R
2
=
0.304)
Model II
(
R
2
=
0.456)
Model III
(
R
2
=
0.492)
R p
β
p
β
p
β
p
Aortic PWV
Log-RDW 0.469
<
0.001 0.551
<
0.001 0.506
<
0.001 0.457
<
0.001
Resting
heart rate 0.417
<
0.001
0.393
<
0.001 0.421
<
0.001
Age
0.188 0.022
0.196 0.003
BMI
0.223 0.007
WHR 0.128 0.174
For regression analyses of aortic PWV; predictors in model I: log-RDW; predic-
tors in model II: log-RDW and resting heart rate; predictors in model III: log-
RDW, resting heart rate and age.
Aix75: augmentation index 75; BMI: body mass index; PWV: pulse-wave veloc-
ity; RDW: red cell distribution width; WHR: waist–hip ratio.
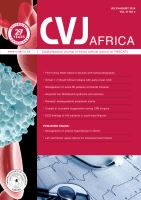
18
16
14
12
10
8
6
0.95 1.00 1.05 1.10 1.15 1.20 1.25
Log-RDW
Pulse wave velocity, m/s
n
=
149
β
=
0.469
p
<
0.001
18
16
14
12
10
8
6
60
80
100
120
Heart rate, beats per minute
Pulse wave velocity, m/s
n
=
149
β
=
0.417
p
<
0.001
18
16
14
12
10
8
6
20
40
60
80
Age, years
Pulse wave velocity, m/s
n
=
149
β
=
0.188
p
<
0.022
1.25
1.20
1.15
1.10
1.05
1.00
0.95
15 20 25 30 35 40
Body mass index, kg/m
2
Log-RDW
n
=
149
β
=
0.239
p
<
0.004
Fig. 3.
Scatter plot showing correlations of related parameters with each other. Aortic PWV with log-RDW (A), heart rate (B), age
(C), and log-RDW with BMI (D). BMI: body mass index; PWV: pulse-wave velocity; RDW: red cell distribution wave.
C
A
D
B