


 45 / 92

CARDIOVASCULAR JOURNAL OF AFRICA • Volume 27, No 4, July/August 2016
AFRICA
247
Methods
A total of 159 consecutive overweight or obese volunteers
without overt cardiovascular disorders was enrolled as the case
group and 48 healthy volunteers formed the control group in
this community-based, cross sectional study (age between 18
and 75 years, mean 38
±
11 and 37
±
7 years, respectively). Fifty-
eight of the case group who had systemic diseases, were on any
medication, and consumed alcohol or smoked were excluded
from the study.
The aortic PWV and aortic normalised augmentation index to
75 beats/min heart rate (Aix75) were measured in the remaining
participants. The case subjects were divided into two groups
based on aortic PWV values; those with aortic PWV
≥
10 m/s
were included in group I, and those with aortic PWV
<
10 m/s
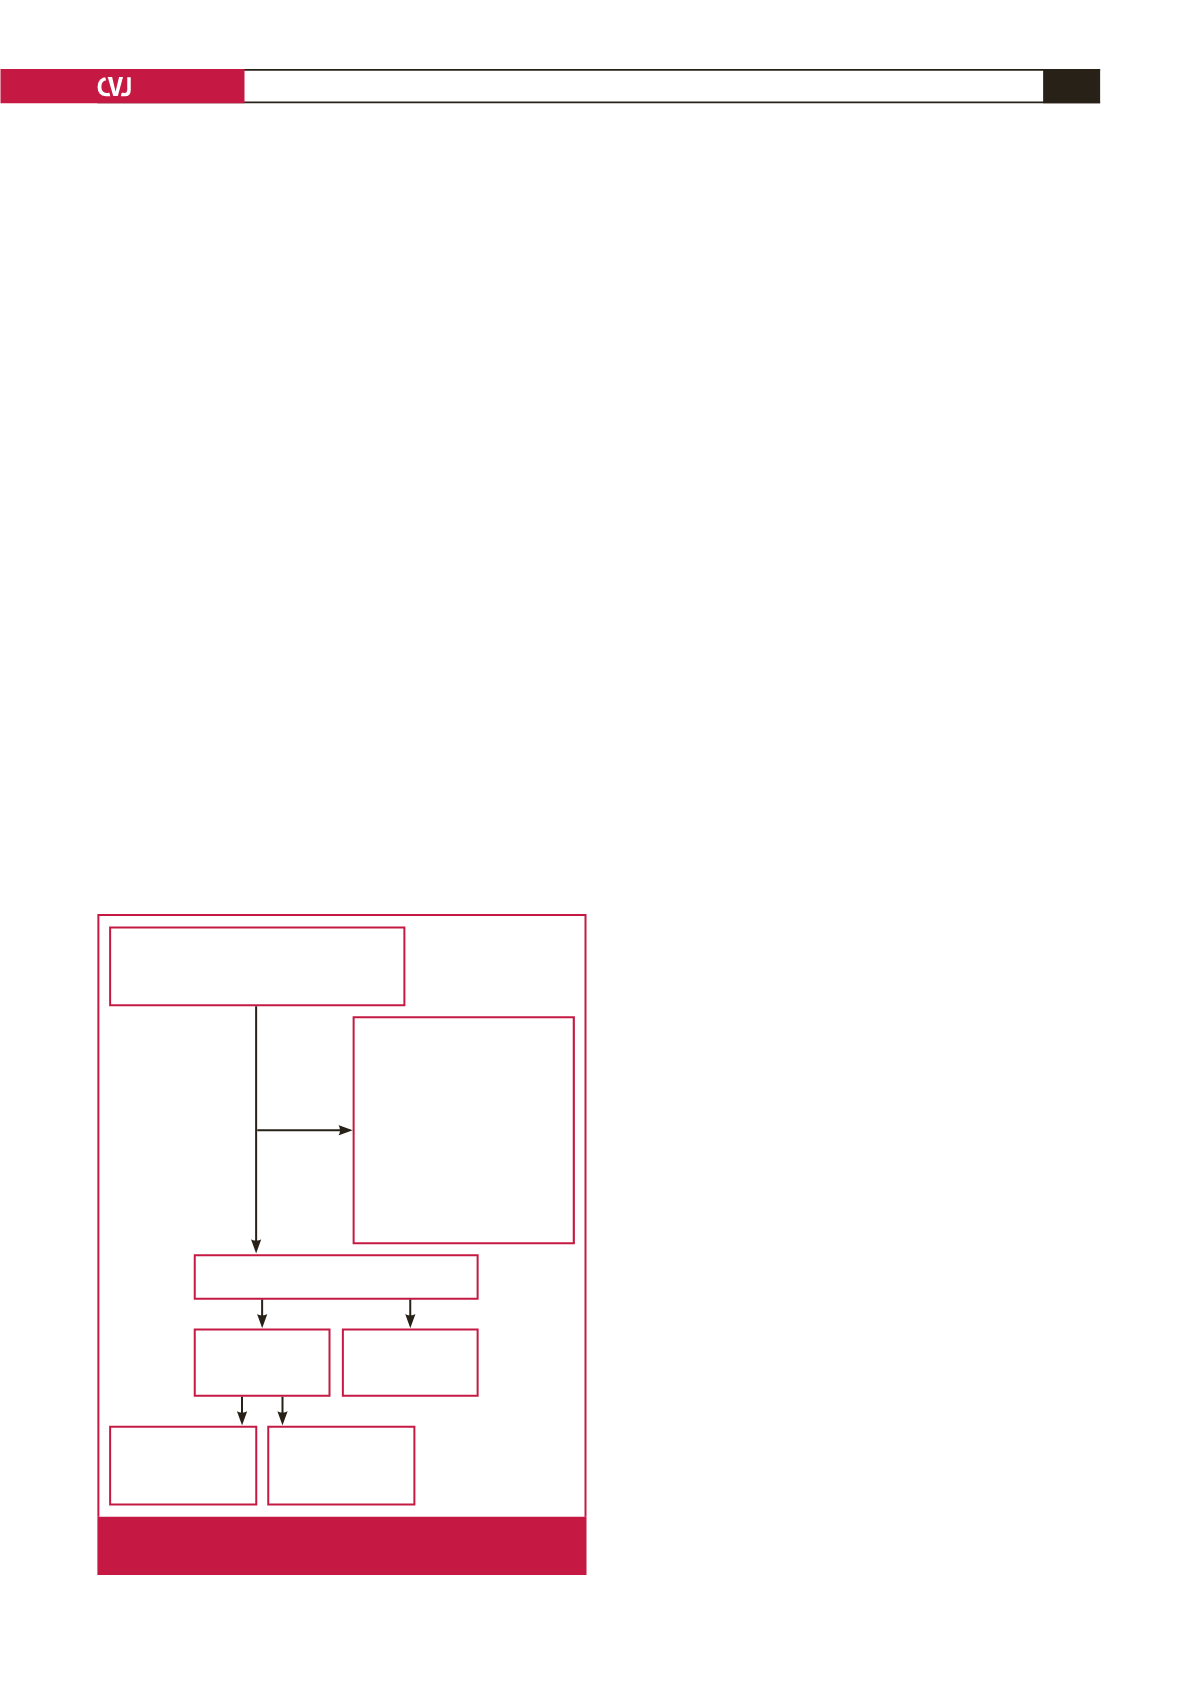
were included in group II. The study design is shown in Fig. 1.
The study conformed to the recommendations of the
Declaration of Helsinki on biomedical research involving
human subjects. The study protocol was approved by the ethics
committee and each participant provided written, informed
consent.
Measurement of RDW and AS
Samples of peripheral venous blood were drawn from the
antecubital vein on admission after local antisepsis. Complete
blood counts were measured using an autoanalyser (Sysmex
K-1000, Block Scientific, USA) within five minutes of sampling.
RDW (%) is one of the parameters automatically calculated
during a full blood count. It is an index of the size distribution
of red blood cells.
The following measurements were assessed on a TensioMed
TM
arteriograph (TensioMed Ltd, Hungary): aortic PWV (m/s),
aortic Aix75 (%), resting heart rate (beats/min), and systolic
and diastolic blood pressures (mmHg). These parameters were
measured according to the recommendations of the European
Society of Hypertension for blood pressure and resting heart
rate measurements.
13
Subjects rested in the sitting position for at least five minutes
andmeasurementswere takennon-invasivelyusing anappropriate
cuff on the TensioMed
TM
arteriograph. The choice of cuff size
(small, medium and large) was automatically determined by
the arteriography according to the arm circumference, and the
jugulum symphysis size reflects the interval from the aortic root
to the bifurcation.
Arteriography perceives brachial artery pulsations based
on the oscillometric principle, and assesses parameters of AS
by analysing pulse-wave forms. Aortic PWV is determined by
calculating the travelling time of the pulse wave between two
reference points.
14
As there is a linear relationship between heart
rate and Aix, the Aix is standardised to a heart rate of 75 beats/
min (Aix75). Aix (%) represents the ratio of reflected wave to
primary wave, which moves from heart to tissues. It is inversely
associated with arterial or aortic compliance.
15
All parameters were measured by the investigators in the
morning between 8:00 and 10:00, after 12 hours of fasting, and
the average of at least three measurements was used.
Statistical analysis
All analyses were done using SPSS version 20.0 (IBMCorporation,
USA). The parameters were expressed as numbers (percentage)
for categorical data, mean
±
SD for parametric data, and median
with interquartile range (IQR) for non-parametric data. We used
the one-sample Kolmogorow–Smirnow test to assess normality of
the data. The Student’s
t
-test (for parametric data) and the Mann–
Whitney
U
-test (for non-parametric data) were used to compare
variables between the two groups. Also, ANOVA and the Kruskal–
Wallis tests were used for comparisons between the three groups
(for parametric and non-parametric variables, respectively). To
test gender differences between the groups, the chi-squared test or
Fisher’s exact test, where appropriate, were used.
Statistical significance between the variables was set at
p
<
0.05.
We used bivariate correlation analysis to determine the correlation
between statistically significant variables. Pearson’s correlation
was used for data with normal distributions, and Spearman’s
correlation was used for data with a skewed distribution.
After definition of the factors that were associated with aortic
PWV in bivariate analysis, independent predictors for estimation
of aortic PWV were determined using multiple linear regression
analyses with stepwise exclusion of these factors, using a
criterion of
p
<
0.05 for retention of factors in the model. When
evaluating RDW with skewed distribution in these analyses
(correlation and regression), the variable was log-transformed
(ln) and this logarithmic value was entered into the correlation
and regression models.
Results
The clinical and laboratory parameters of the two groups are
presented in Table 1. Aortic PWV, RDW, body mass index (BMI)
58 subjects with
≥
25 BMI
were excluded due to:
• Diabetes mellitus
• Hypertension
• Rheumatological
disorders
• Chronic renal
insufficiency
• Smoking
• Alcohol consumption
• Any medication
Case group
n
=
101
Group I
(PWV
≥
10 m/s)
n
=
47
Control group
n
=
48
Group II
(PWV
<
10 m/s)
n
=
54
149 subjects enrolled in the study
159 subjects with
≥
25 BMI without
overt cardiovascular disease and
48 healthy volunteers (BMI
<
25)
Fig. 1.
Diagram of the study design. BMI: body mass index;
PWV: pulse-wave velocity.