


 46 / 92

CARDIOVASCULAR JOURNAL OF AFRICA • Volume 27, No 4, July/August 2016
248
AFRICA
and waist–hip ratio were considerably higher in the case groups
than the controls (
p
<
0.05) (Table 1). In subgroup analyses,
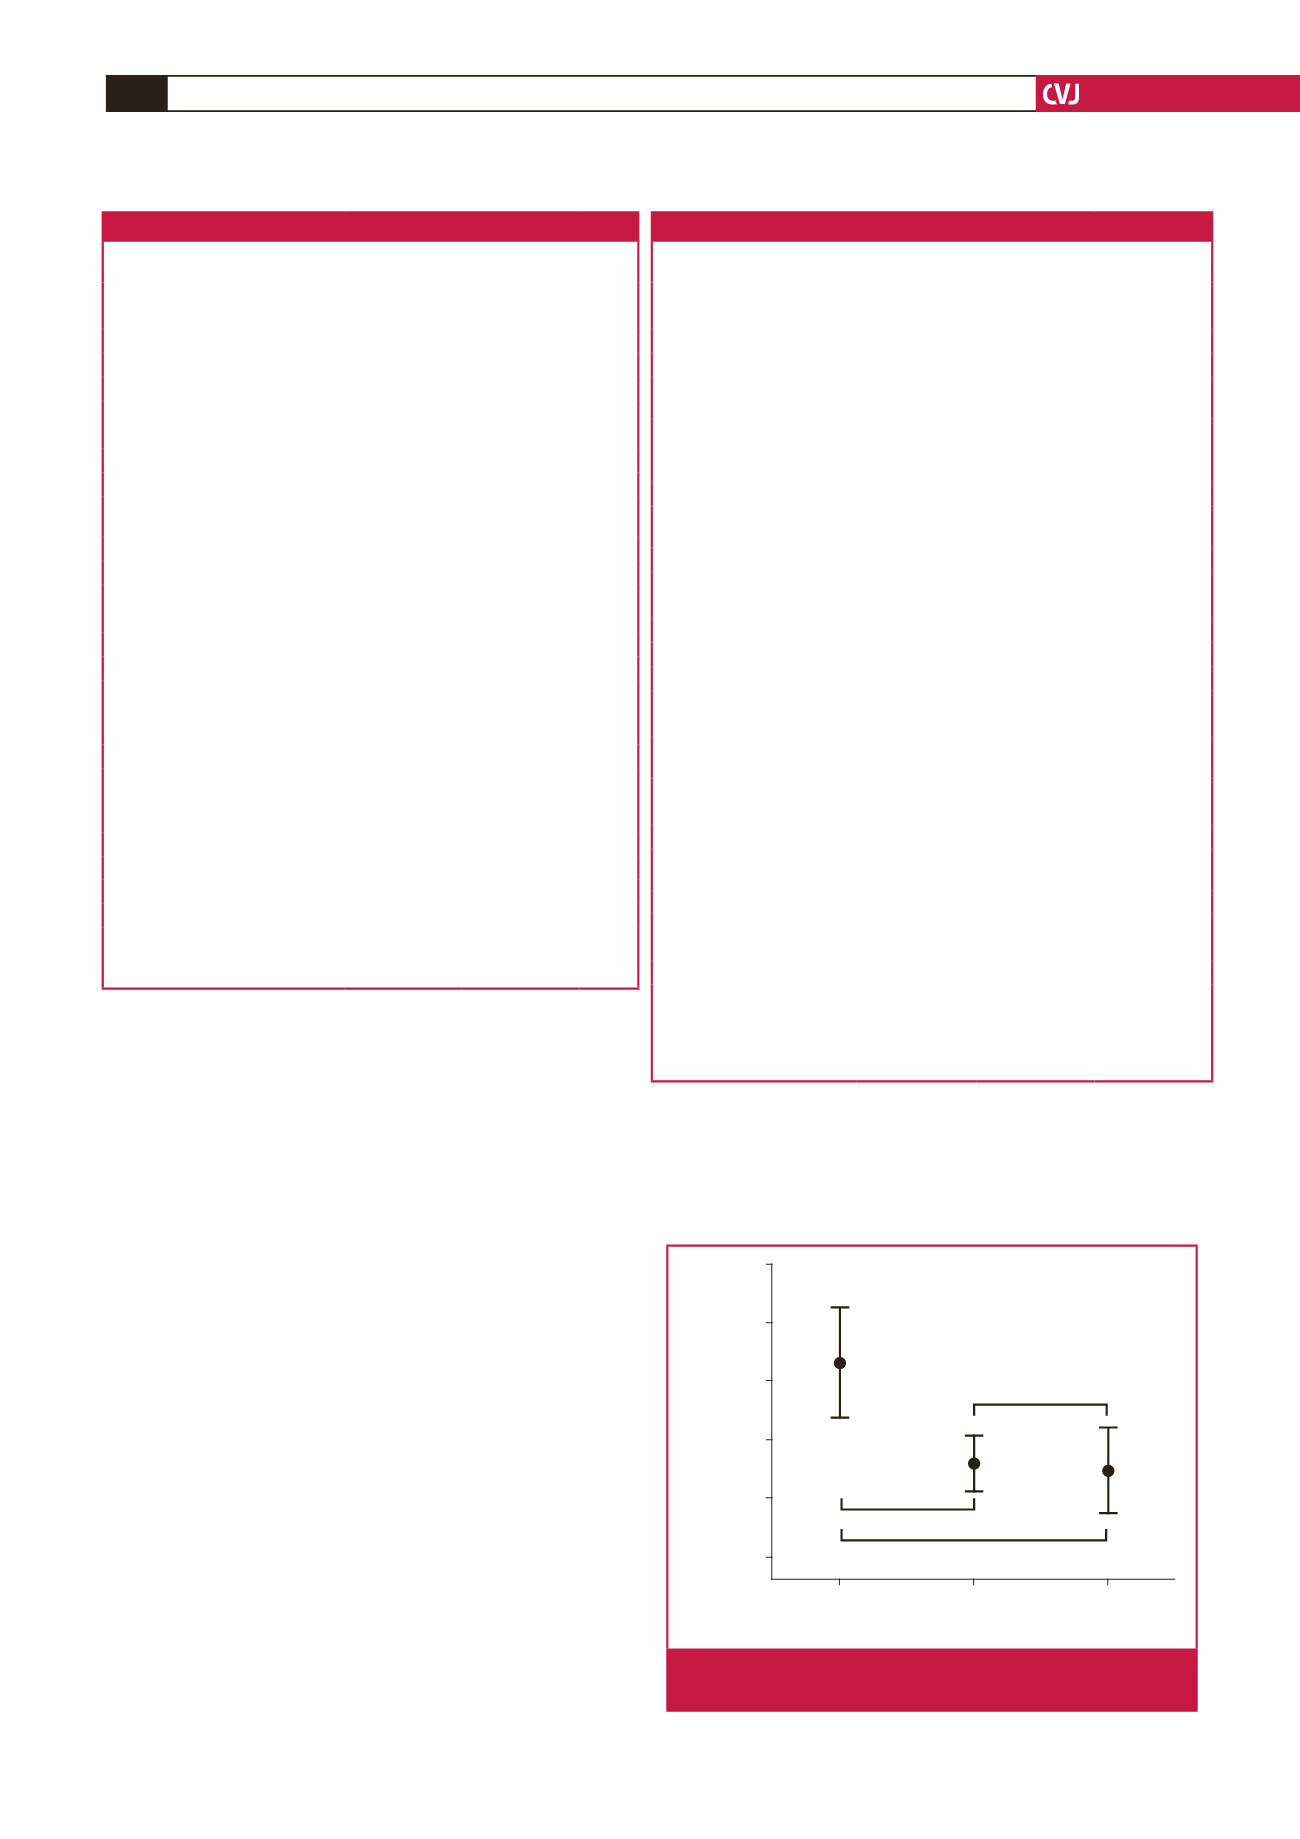
RDW was significantly increased in group I compared with
group II and the controls (
p
=
0.003 and
p
<
0.001, respectively),
although there was no statistically significant change between
group II and the controls (
p
>
0.05) (Table 2, Fig. 2).
Aortic PWV was significantly higher in group I than in group
II and the controls (
p
<
0.001 for both); however, it was similar
in group II and the controls (
p
>
0.05). Although age was similar
in group II and the controls (
p
>
0.05), it was considerably
higher in group I than in group II (
p
=
0.046). While BMI and
waist–hip ratio were significantly higher in groups I and II than
in the controls, as expected (
p
<
0.001), there was no statistically
significant difference between groups I and II (
p
>
0.05) (Table 2).
Bivariate correlation analyses showed positive correlations of
log-RDW, resting heart rate, age and BMI with aortic PWV (
p
<
0.001,
p
<
0.001,
p
=
0.022, and
p
=
0.007, respectively) (Table
3, Fig. 3A–C). Also, there was a positive correlation between
log-RDW and BMI (Fig. 3D). However, multiple regression
analyses (stepwise) using variables with significant correlation
revealed that log-RDW, resting heart rate and age independently
predicted aortic PWV. Of these, log-RDWwas a stronger predictor
than age and resting heart rate in the final model (Table 3).
Discussion
The main findings of this community-based, prospective study
were: (1) the subjects with high aortic PWV had advanced
age, increased RDW and increased resting heart rate; (2) these
parameters were positively correlated with aortic PWV; and
(3) log-RDW, resting heart rate and age were independent
predictors for increased aortic stiffness (aortic PWV
≥
10 m/s),
Table 1. Comparison of case group with control group
Parameters
Case group
(
n
=
101)
Control group
(
n
=
48)
p-
value
Male,
n
(%)
72 (71)
32 (67)
0.566
Age, years
38
±
11
37
±
7
0.564
Body mass index, kg/m
2
28.8
±
3.3
22.4
±
1.6
<
0.001
Waist–hip ratio
0.91
±
0.10
0.82
±
0.07
<
0.001
Systolic blood pressure, mmHg
121
±
9
120
±
8
0.655
Diastolic blood pressure, mmHg
78
±
5
77
±
6
0.110
Resting heart rate, beats/min
77
±
11
76
±
12
0.719
Aortic pulse wave velocity, m/s
9.9
±
2.0
9.1
±
2.3
0.027
Aortic augmentation index 75, % 19
±
11
17
±
12
0.275
Fasting glucose, mg/dl
(mmol/l)
90
±
5
(5
±
0.28)
88
±
6
(4.88
±
0.33)
0.056
Urea, mg/dl
28
±
5
26
±
5
0.058
Creatinine, mg/dl
0.80
±
0.08
0.78
±
0.08 0.175
(mmol/l)
(70.72
±
7.07)
(68.95
±
7.07)
Alanine aminotransferase, U/l
26
±
5
24
±
4
0.059
Triglycerides, mg/dl
150
±
19
149
±
21
0.919
(mmol/l)
(1.70
±
0.21)
(1.68
±
0.24)
Total cholesterol, median (IQR),
mg/dl
177 (128–244)
176 (116–227)
0.201*
(mmol/l)
[4.58 (3.32–6.32)] [4.56 (3.0–5.88)]
LDL cholesterol, mg/dl
109
±
19
102
±
17
0.154
(mmol/l)
(2.82
±
0.49)
(2.64
±
0.44)
HDL cholesterol, median (IQR),
mg/dl
42 (33–52)
42 (38–53)
0.184*
(mmol/l)
[1.09 (0.85–1.35)] [1.09 (0.98–1.37)]
RDW, median (IQR), %
11.9 (10.2–17.5) 11.4 (9.6–15.5) 0.005*
White blood cell, 10
3
/µl
8.1
±
1.6
7.6
±
1.6
0.086
Haematocrit, %
44
±
5
43
±
5
0.219
IQR: interquartile range; HDL: high-density lipoprotein; LDL: low-density
lipoprotein; RDW: red cell distribution width.
*
p
-value of Mann–Whitney
U
-test.
13.50
13.00
12.50
12.00
11.50
11.00
Group I
Group II
Control
Groups
95% CI, red cell distribution width, %
p
>
0.05
p
=
0.003
p
<
0.001
Fig. 2.
The error bar graph showing RDW difference between
the groups. RDW: red cell distribution width.
Table 2. Comparison of variables between the three groups
Parameters
Group I
(
n
=
47)
Group II
(
n
=
54)
Control
(
n
=
48)
Males,
n
(%)
34 (72)
34 (63)
32 (67)
Age, years
41
±
12
a
36
±
9
37
±
7
Body mass index, kg/m
2
29.1
±
3.4
b
28.3
±
2.9
c
22.4
±
1.6
Waist–hip ratio
0.94
±
0.10
b
0.90
±
0.09
c
0.82
±
0.07
Systolic blood pressure,
mmHg
122
±
8
120
±
10
120
±
8
Diastolic blood pressure,
mmHg
80
±
5
78
±
6
77
±
6
Resting heart rate, beats/min
81
±
11
74
±
12
a
76
±
12
Aortic pulse wave velocity, m/s 11.6
±
1.4
a,b
8.4
±
0.9
9.0
±
2.3
Aortic augmentation index
75, %
23
±
13
17
±
9
17
±
12
Fasting glucose, mg/dl
90
±
5
89
±
6
88
±
6
(mmol/l)
(5
±
0.28)
(4.94
±
0.33)
(4.88
±
0.33)
Urea, mg/dl
28
±
5
28
±
4
26
±
5
Creatinine, mg/dl
0.81
±
0.06
0.80
±
0.09
0.78
±
0.08
(mmol/l)
(71.60
±
5.30)
(70.72
±
7.96)
(68.95
±
7.07)
Alanine aminotransferase, U/l
25
±
5
27
±
4
24
±
4
Triglycerides, mg/dl
150
±
19
148
±
17
149
±
21
(mmol/l)
(1.70
±
0.21)
(1.67
±
0.19)
(1.68
±
0.24)
Total cholesterol, median
(IQR), mg/dl
177 (128–244)
178 (136–223)
176 (116–227)
(mmol/l)
[4.58 (3.32–6.32)] [4.61 (3.52–5.78)] [4.56 (3.0–5.88)]
LDL cholesterol, mg/dl
106
±
18
108
±
18
102
±
17
(mmol/l)
(2.75
±
0.47)
(2.80
±
0.47)
(2.64
±
0.44)
HDL cholesterol, median
(IQR), mg/dl
41 (34–52)
42 (33–48)
42 (38–53)
(mmol/l)
[1.06 (0.88–1.35)] [1.09 (0.85–1.24)] [1.09 (0.98–1.37)]
RDW, median (IQR), % 12.0 (10.5–17.5)
a,b
11.7 (10.2–14.2) 11.4 (9.6–15.5)
White blood cell, 10
3
/µl
8.3
±
1.7
7.9
±
1.6
7.6
±
1.6
Haematocrit, %
44
±
7
45
±
4
43
±
5
Group I: pulse-wave velocity
≥
10 m/s; group II: pulse-wave velocity
<
10 m/s; IQR:
interquartile range; HDL: high-density lipoprotein; LDL: low-density lipoprotein;
RDW: red cell distribution width.
a
p
<
0.05 between group I and II;
b
p
<
0.05 between group I and control;
c
p
<
0.05
between group II and control.