


 40 / 76

CARDIOVASCULAR JOURNAL OF AFRICA • Volume 27, No 6, November/December 2016
370
AFRICA
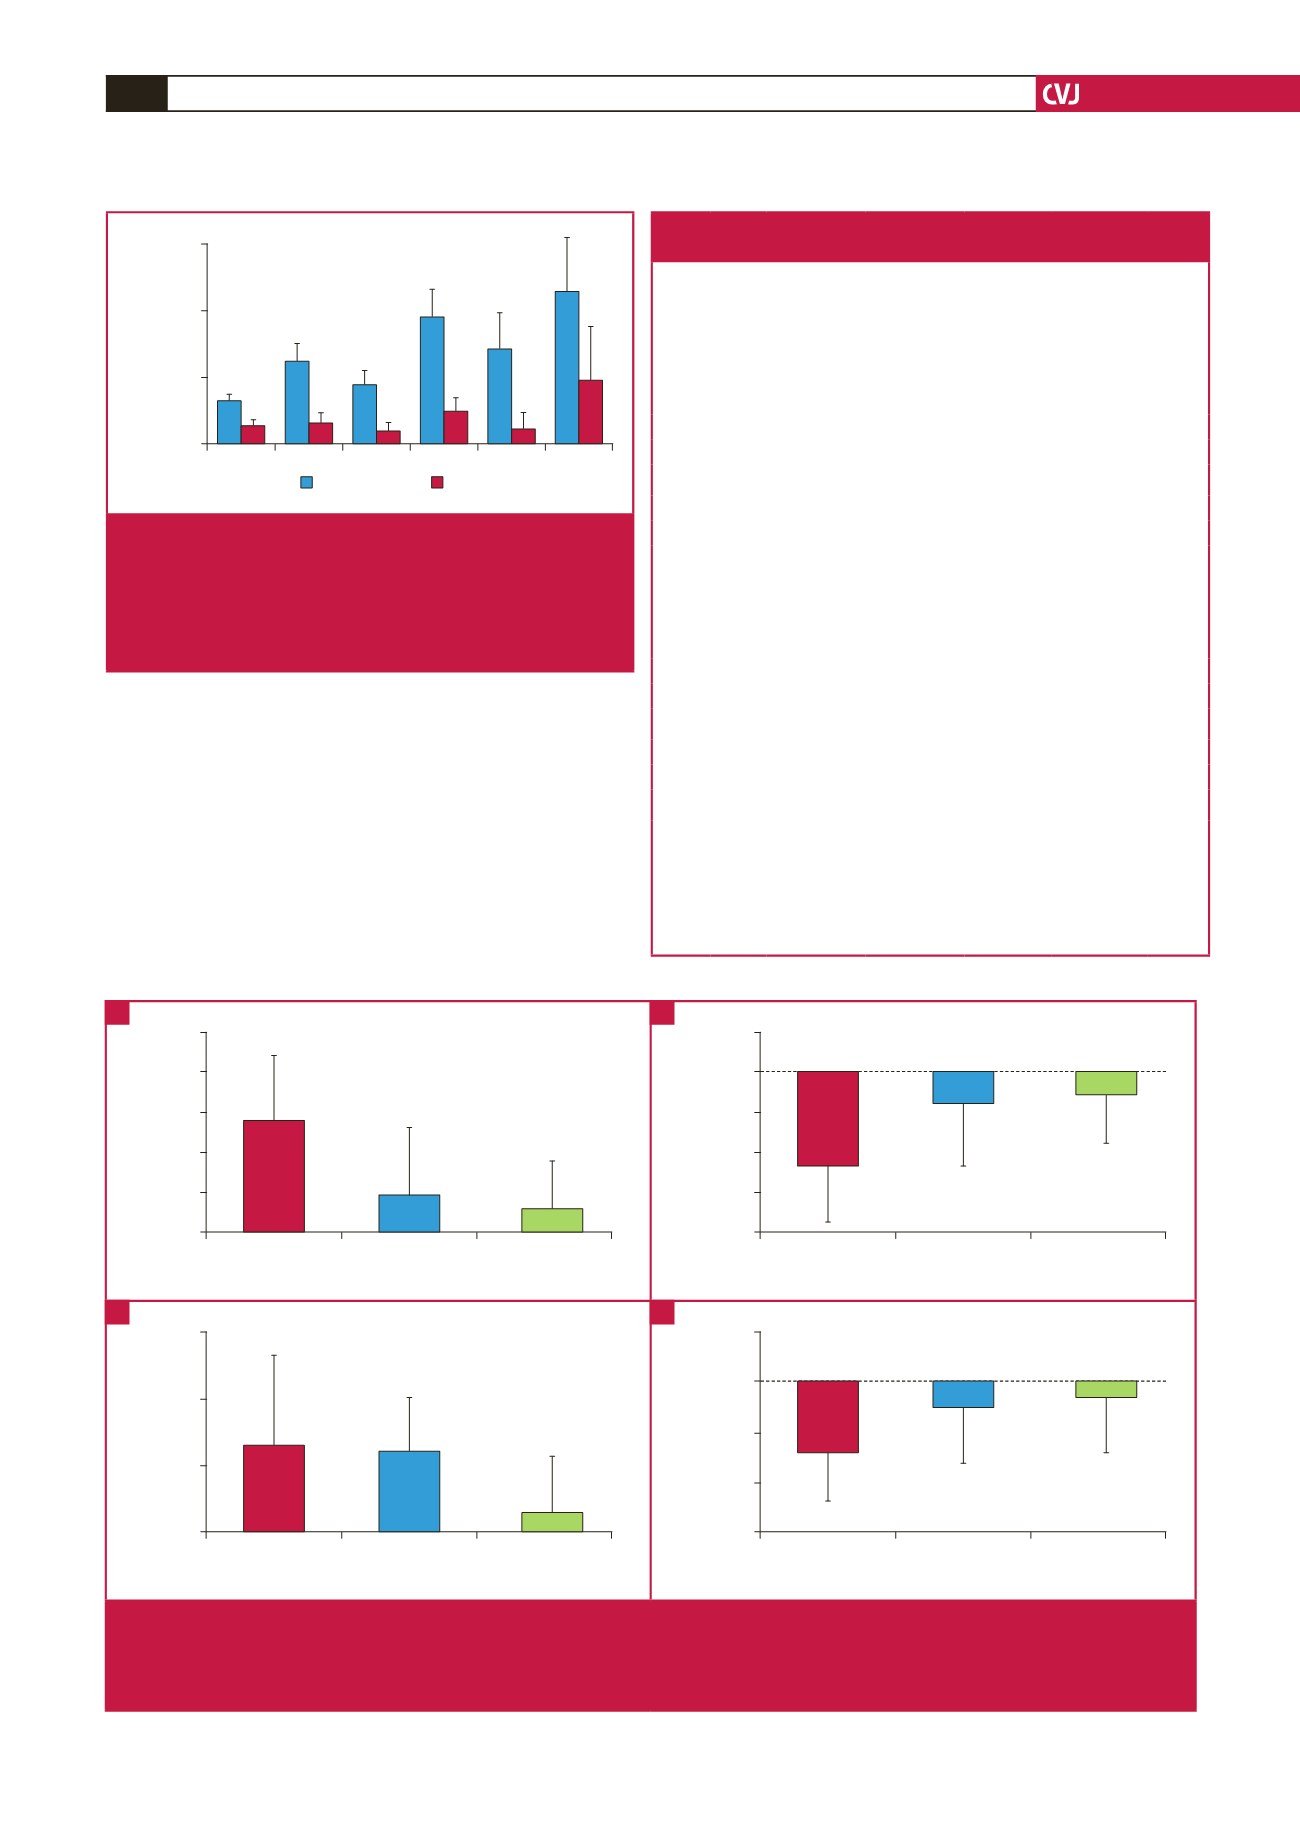
body fat distribution, such that there was a significant increase in
central fat mass (trunk and android as a percentage of fat mass)
and decrease in peripheral fat mass (appendicular and gynoid as
a percentage of fat mass) in the NO group, but not the two obese
groups (Fig. 3).
As baseline BMI was a strong determinant of weight gain
over the follow-up period, differences in baseline SES and
lifestyle variables were also examined between BMI groups (NO,
OBc1 and OBc2). There were no differences in baseline SES,
reproductive health, moderate- to vigorous-intensity physical
Table 2. Changes in body composition over the 5.5-year follow-up period
by baseline BMI groups
Param-
eters
BMI
(kg/m
2
)
Baseline
(kg)
Follow up
(kg)
Absolute
change
(kg)
% change
p-
value
for %
change
Weight
(kg)
NO 61.2
±
9.2 71.7
±
9.6 10.4
±
5.4 17.6
±
9.7
#
0.009
OBc1 85.9
±
6.4 91.6
±
12.2 5.6
±
12.1 6.8
±
14.2
OBc2 100.4
±
14.5 105.1
±
15.2 4.7
±
10.5 5.2
±
10.8
Fat
mass
(kg)
NO 19.6
±
5.8 26.3
±
5.8 6.7
±
4.1 39.6
±
31.8
#
<
0.001
OBc1 37.5
±
5.5 40.7
±
9.4 2.5
±
8.5 7.6
±
23.8
OBc2 46.7
±
10.2 50.0
±
11.5 3.6
±
7.2 8.0
±
16.4
TFM
(kg)
NO 7.6
±
2.7
11.6
±
2.9 4.0
±
2.1 63.2
±
51.9
#
<
0.001
OBc1 16.5
±
3.6 18.7
±
5.3 1.8
±
4.7 13.7
±
32.9
OBc2 21.6
±
4.9 23.7
±
5.5 2.2
±
3.9 11.0
±
20.1
ApFM
(kg)
NO 11.1
±
3.4 13.8
±
3.2 2.6
±
2.1 27.9
±
26.1
#
0.003
OBc1 20.2
±
3.2 21.2
±
5.4 0.8
±
4.0 3.3
±
20.6
OBc2 24.1
±
6.2 25.4
±
7.0 1.4
±
3.6 5.8
±
15.3
SAT
(cm
2
)
NO 227.1
±
100.5 300.4
±
78.3 90.5
±
68.4 58.9
±
62.6
#
0.033
OBc1 487.7
±
107.7 495.7
±
107.7 15.6
±
99.3 2.3
±
27.2
OBc2 637.1
±
118.9 651.6
±
131.4 18.8
±
84.1 2.2
±
13.5
VAT
(cm
2
)
NO 31.9
±
12.5 54.9
±
29.4 24.8
±
23.1 94.1
±
101.1
#
0.003
OBc1 77.3
±
44.3 81.4
±
38.2 2.9
±
38.9 15.4
±
67.8
OBc2 73.4
±
36.0 99.9
±
38.6 1.5
±
23.5 7.7
±
30.5
Data are represented as means
±
standard deviations. Groups are divided into BMI
at baseline as NO:
<
30 kg/m
2
(
n
=
17), OBc1: 30–34.9 kg/m
2
(
n
=
17) and OBc2:
≥
35
kg/m
2
(
n
=
30).
#
Change in NO group significantly greater than both OB groups, Kruskal–Wallis
used for the relative change in SAT and VAT.
BMI, body mass index; TFM, trunk fat mass; ApFM, appendicular fat mass; SAT,
subcutaneous adipose tissue, VAT, visceral adipose tissue.
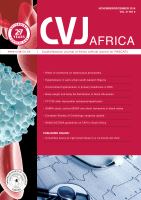
W FM ApFM TFM SAT VAT
%
Δ
60
40
20
0
*
*
*
*
< 25 years
≥
25 years
Fig. 2.
Percentage changes in body composition variables
in younger (
<
25 years) and older age groups (
≥
25
years). Data are means
±
standard error. W, weight;
FM, fat mass; ApFM, appendicular fat mass; TFM,
trunk fat mass; SAT, superficial adipose tissue; VAT,
visceral adipose tissue; *
p
<
0.01.
NO
OBc1
OBc2
Δ
Trunk FM (%FM)
10
8
6
4
2
0
*
Baseline BMI
NO
OBc1
OBc2
Δ
Appendicular FM (%FM)
2
0
–2
–4
–6
–8
*
Baseline BMI
NO
OBc1
OBc2
Δ
Android FM (%FM)
3
2
1
0
*
Baseline BMI
NO
OBc1
OBc2
Δ
Gynoid FM (%FM)
1
0
–1
–2
–3
*
Baseline BMI
Fig. 3.
Changes in body fat distribution, expressed as a percentage of total fat mass (kg), in three baseline BMI groups. Data are
represented as means
±
standard deviation, FM; fat mass. Three BMI groups defined at baseline: NO:
<
30 kg/m
2
, OBc1:
30–34.9 kg/m
2
and OBc2:
≥
35 kg/m
2
. *Change in NO group significantly different to both other BMI groups,
p
<
0.01 via
Tukey
post-hoc
analysis.
A
C
B
D