


 9 / 80

CARDIOVASCULAR JOURNAL OF AFRICA • Volume 28, No 3, May/June 2017
AFRICA
143
L-NNA (42.0
±
1.0) and RSV (44.7
±
3.6 ml) application
did not alter the water intake, whereas it was found to be
significantly lower in the L-NNA
+
RSV50 (25.9
±
2.9 ml) and
RSV-E (26.8
±
4.3 ml) groups compared to the control group
(33.7
±
4.1 ml) (Table 3).
Compared to the control group (11.6
±
1.2 ml), urine volume
did not change in the L-NNA (14.0
±
0.5 ml), RSV50 (10.1
±
0.3 ml) and L-NNA
+
RSV50 (12.9
±
1.2 ml) groups. However,
interestingly, urine volume (3.3
±
1.1 ml) as well as water intake
was significantly lower in the RSV-E group (Table 3).
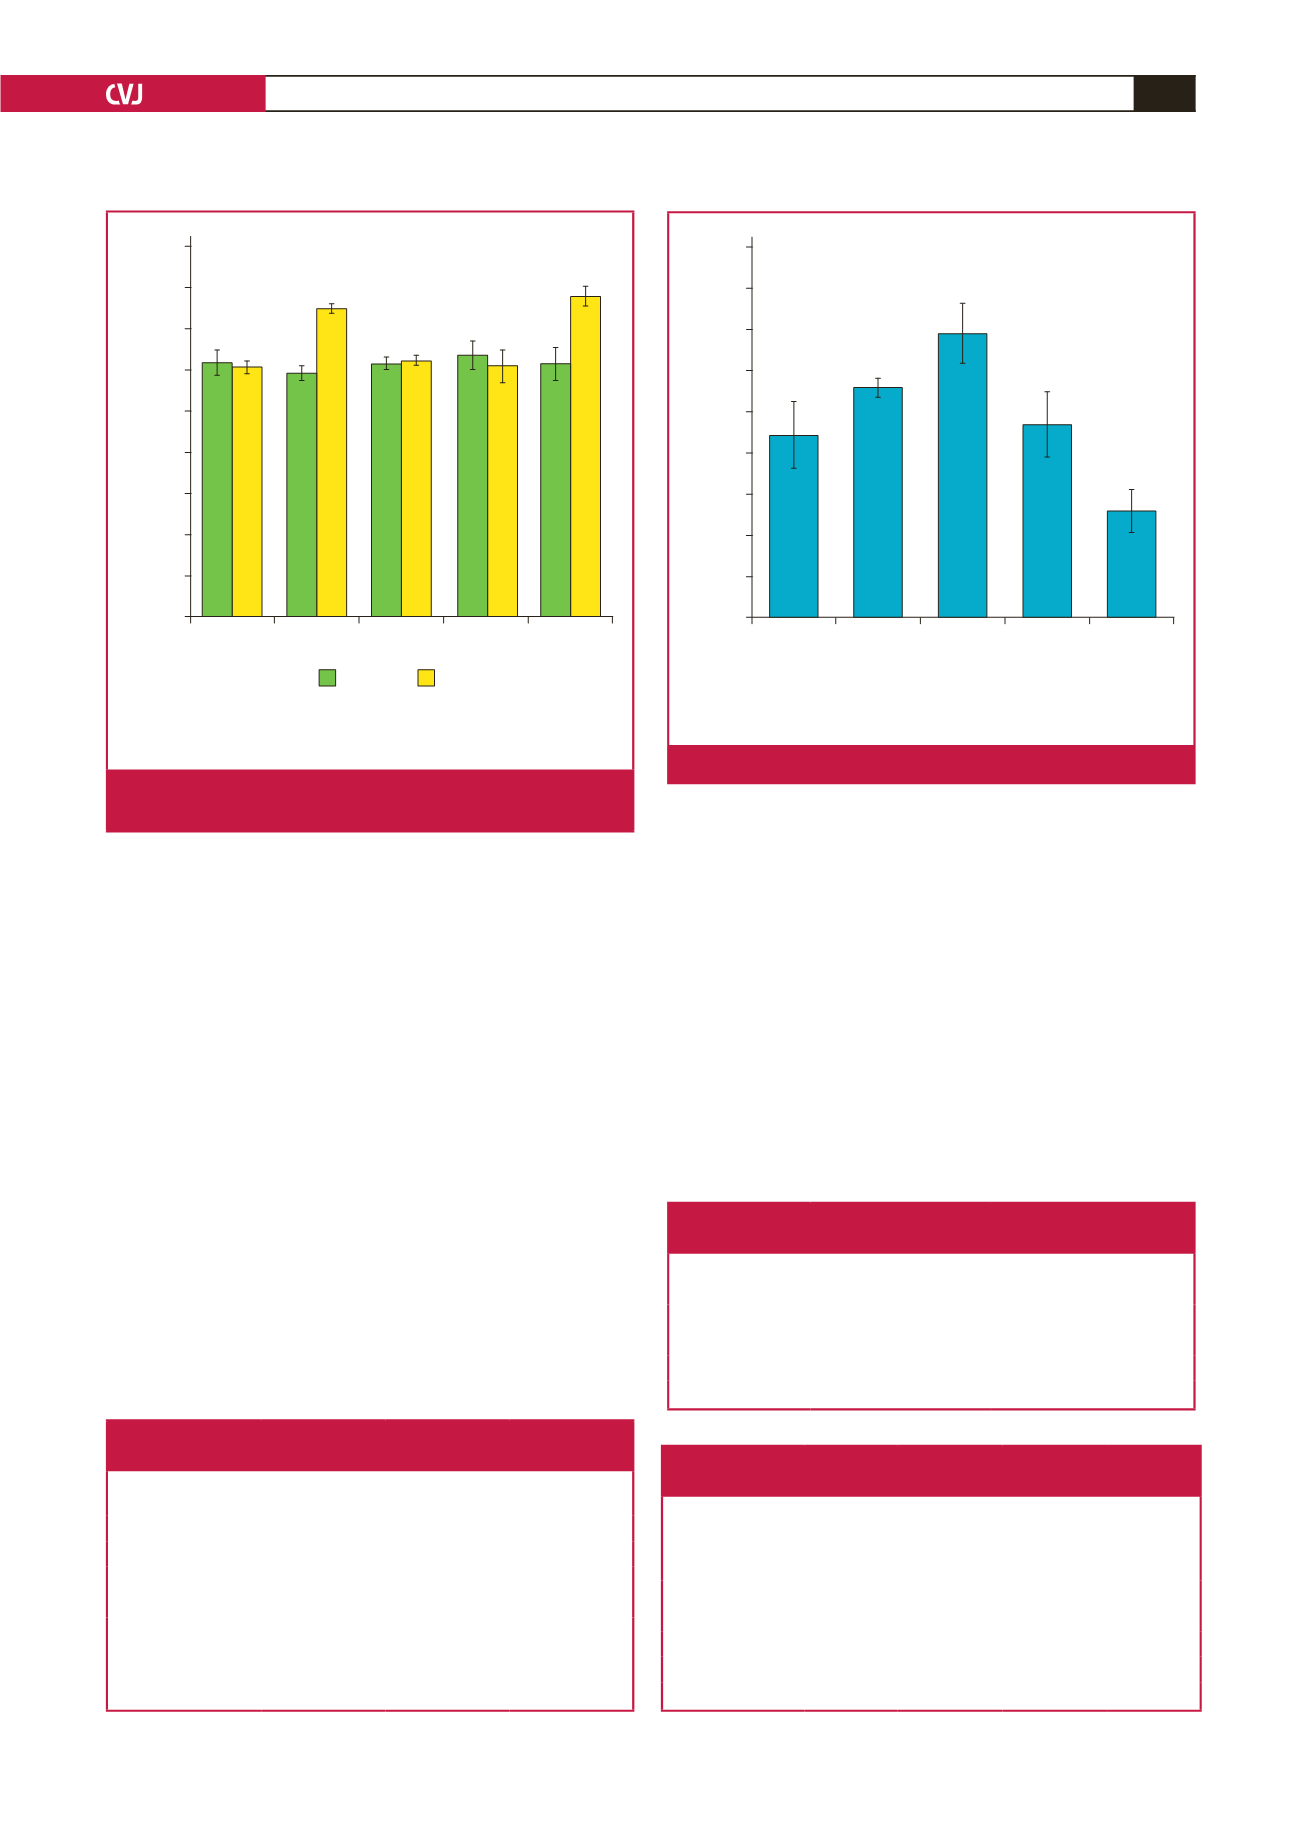
Although the application of RSV with L-NNA decreased the
fluid balance (13.0
±
2.4 ml), RSV application alone increased it
(34.6
±
3.5 ml). L-NNA application alone did not alter (28.0
±
1.0 ml) the fluid balance compared to the control group (22.0
±
4.0 ml) (Table 3, Fig. 2).
Serum and urine sodium concentrations (Table 4) and urea
and creatinine (Table 5) levels were similiar between the groups.
Applications did not alter the values measured at the end of the
study compared with those measured at the beginning of the
protocol (data not shown).
RSV and L-NNA application alone did not alter C
Na
, however
it was lower in the RSV-E (0.0015
±
0.0007 ml/min) group
compared to both the RSV50 (0.0042
±
0.0007 ml/min) and
L-NNA (0.0055
±
0.0011 ml/min) groups (Table 6, Fig. 3).
GFR was significantly lower in the RSV-E group (0.32
±
0.09
ml/min) compared to the other groups and it was also lower in
the RSV50 group (0.87
±
0.08 ml/min) compared to the L-NNA
(1.30
±
0.16 ml/min) and the L-NNA
+
RSV50 (1.33
±
0.14 ml/
min) groups (Table 6, Fig. 4).
Fractional sodium excretion values were similar in all groups
(Table 6, Fig. 5).
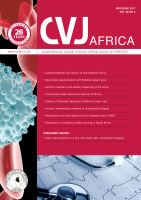
Control
L-NNA RSV50 RSV-E L-NNA +
RSV50
180
160
140
120
100
80
60
40
20
0
Blood pressure (mmHg)
First
Last
✱
βγ
✱
βγ
✱
Compared to control group,
p
<
0.05
β
Compared to RSV50 group,
p
<
0.05
γ
Compared to RSV-E group,
p
<
0.05
Fig. 1.
The first and the last measured blood pressures of the
study groups.
Table 3.Water intake, urine volume and
water balance in the study groups
Groups (
n
=
7)
Water intake
(ml)
Urine volume
(ml)
Water balance
(ml)
Control
33.7
±
4.1
11.6
±
1.2
2 2.1
±
4.1
L-NNA
42
±
1.0
14
±
0.5
28.0
±
1.0
RSV50
44.7
±
3.6
10.1
±
0.3
αγ
34.6
±
3.5
*
RSV-E
26.8
±
4.3
αβ
3.3
±
1.1*
αβ
23.5
±
3.7
L-NNA
+
RSV50 25.9
±
2.9
αβ
12.9
±
1.2*
13
±
2.4
αβ
*Compared to the control group,
p
<
0.05;
α
compared to the L-NNA
group,
p
<
0.05;
β
compared to the RSV50 group,
p
<
0.05;
γ
compared
to the RSV-E group,
p
<
0.05.
Control
L-NNA RSV50 RSV-E L-NNA +
RSV50
45
40
35
30
25
20
15
10
5
0
Water intake – urine volume (ml/day)
✱
αβ
✱
Compared to control group,
p
<
0.05
α
Compared to LNNA group,
p
<
0.05
β
Compared to RSV50 group,
p
<
0.05
Fig. 2.
Fluid balances of the study groups.
Table 4. Serum sodium concentrations
and 24-hour urine samples
Groups (
n
=
7)
Serum Na (mEq/l) 24-hour urine Na (mEq/l)
Control
144.0
±
0.53
0.84
±
0.11
L-NNA
143.4
±
0.4
0.72
±
0.07
RSV50
143.7
±
0.5
0.86
±
0.14
RSV-E
143.5
±
0.4
0.84
±
0.15
L-NNA
+
RSV50
143.2
±
0.4
0.89
±
0.16
Table 5. Creatinine and urea levels in serum
and 24-hour urine samples
Groups (
n
=
7)
Serum
creatinine
(mg/dl)
Serum urea
(mg/dl)
24-hour
urine urea
(mg/dl)
24-hour
urine
creatinine
(mg/dl)
Control
0.38
±
0.01 44.60
±
2.63 57.03
±
2.81 0.58
±
0.03
L-NNA
0.36
±
0.02 48.67
±
2.74 52.60
±
4.15 0.47
±
0.05
RSV50
0.39
±
0.03 40.31
±
2.96 52.21
±
2.86 0.48
±
0.04
RSV-E
0.37
±
0.02 43.65
±
3.77 53.58
±
3.38 0.55
±
0.03
L-NNA
+
RSV50 0.38
±
0.01 44.09
±
0.73 58.44
±
3.60 0.56
±
0.01