


 10 / 80

CARDIOVASCULAR JOURNAL OF AFRICA • Volume 28, No 3, May/June 2017
144
AFRICA
Discussion
It has been demonstrated that vascular oxidative stress plays an
important role in the pathogenesis of essential hypertension,
21
and many experimental studies have been published using
anti-oxidants to prevent the development of hypertension or
to decrease blood pressure. Hu
et al
.
22
showed that apocynin
[a nicotinamide dinucleotide phosphate (NADPH) oxidase
inhibitor] application prevented and reversed dexamethasone-
induced (via NADPH oxidase-mediated superoxide production)
hypertension in rats. Another study revealed that tempol [a
superoxide dismutase (SOD) mimetic] application decreased
blood pressure and renal vascular resistance in spontaneously
hypertensive rats by eliminating unfavourable peroxynitrite
formation from the superoxide by competition with NO.
23
We aimed to investigate the effects of RSV in preventing
the development of hypertension, which was induced by NOS
inhibition. RSV application alone did not alter blood pressure
in the normotensive rats. Application of RSV plus L-NNA did
not reverse the blood pressure increase induced by L-NNA. This
may have been related to the dose of RSV or the length of the
application period. Various protocols have been used in other
studies.
Bhatt
et al
.
24
gave RSV dissolved in drinking water to
rats at a concentration of 50 mg/l for 10 weeks and revealed
that the development of hypertension was attenuated in the
spontaneously hypertensive rats. Gordish
et al.
25
administered
RSV at a dose of 5 mg/kg to rats via the femoral vein and proved
that the acute renal vasodilatory effect of RSV was mediated
by increased NO production/bioavailability and its superoxide-
scavenging effect. We did not measure oxidative stress markers
such as malondialdehyde (MDA), however we possibly achieved
sufficient antioxidant effect by the RSV aplications.
In addition, it was shown that abnormalities in vascular
NO production and transport resulted in hypertension due
to endothelial dysfunction. RSV increased NO synthesis and
functioned as a potent
in vivo
anti-oxidant.
26
Interestingly, in the RSV50 group, the water balance was
significantly higher compared to the control group despite no
significant changes in water intake and urine output. Application
of L-NNA plus RSV decreased the water balance compared to
the application of RSV only, however it was not significantly
different compared to the control group. Decreased urine volume
may have been related to diminished water intake, as found in
previous studies.
27-29
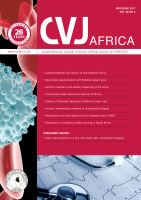
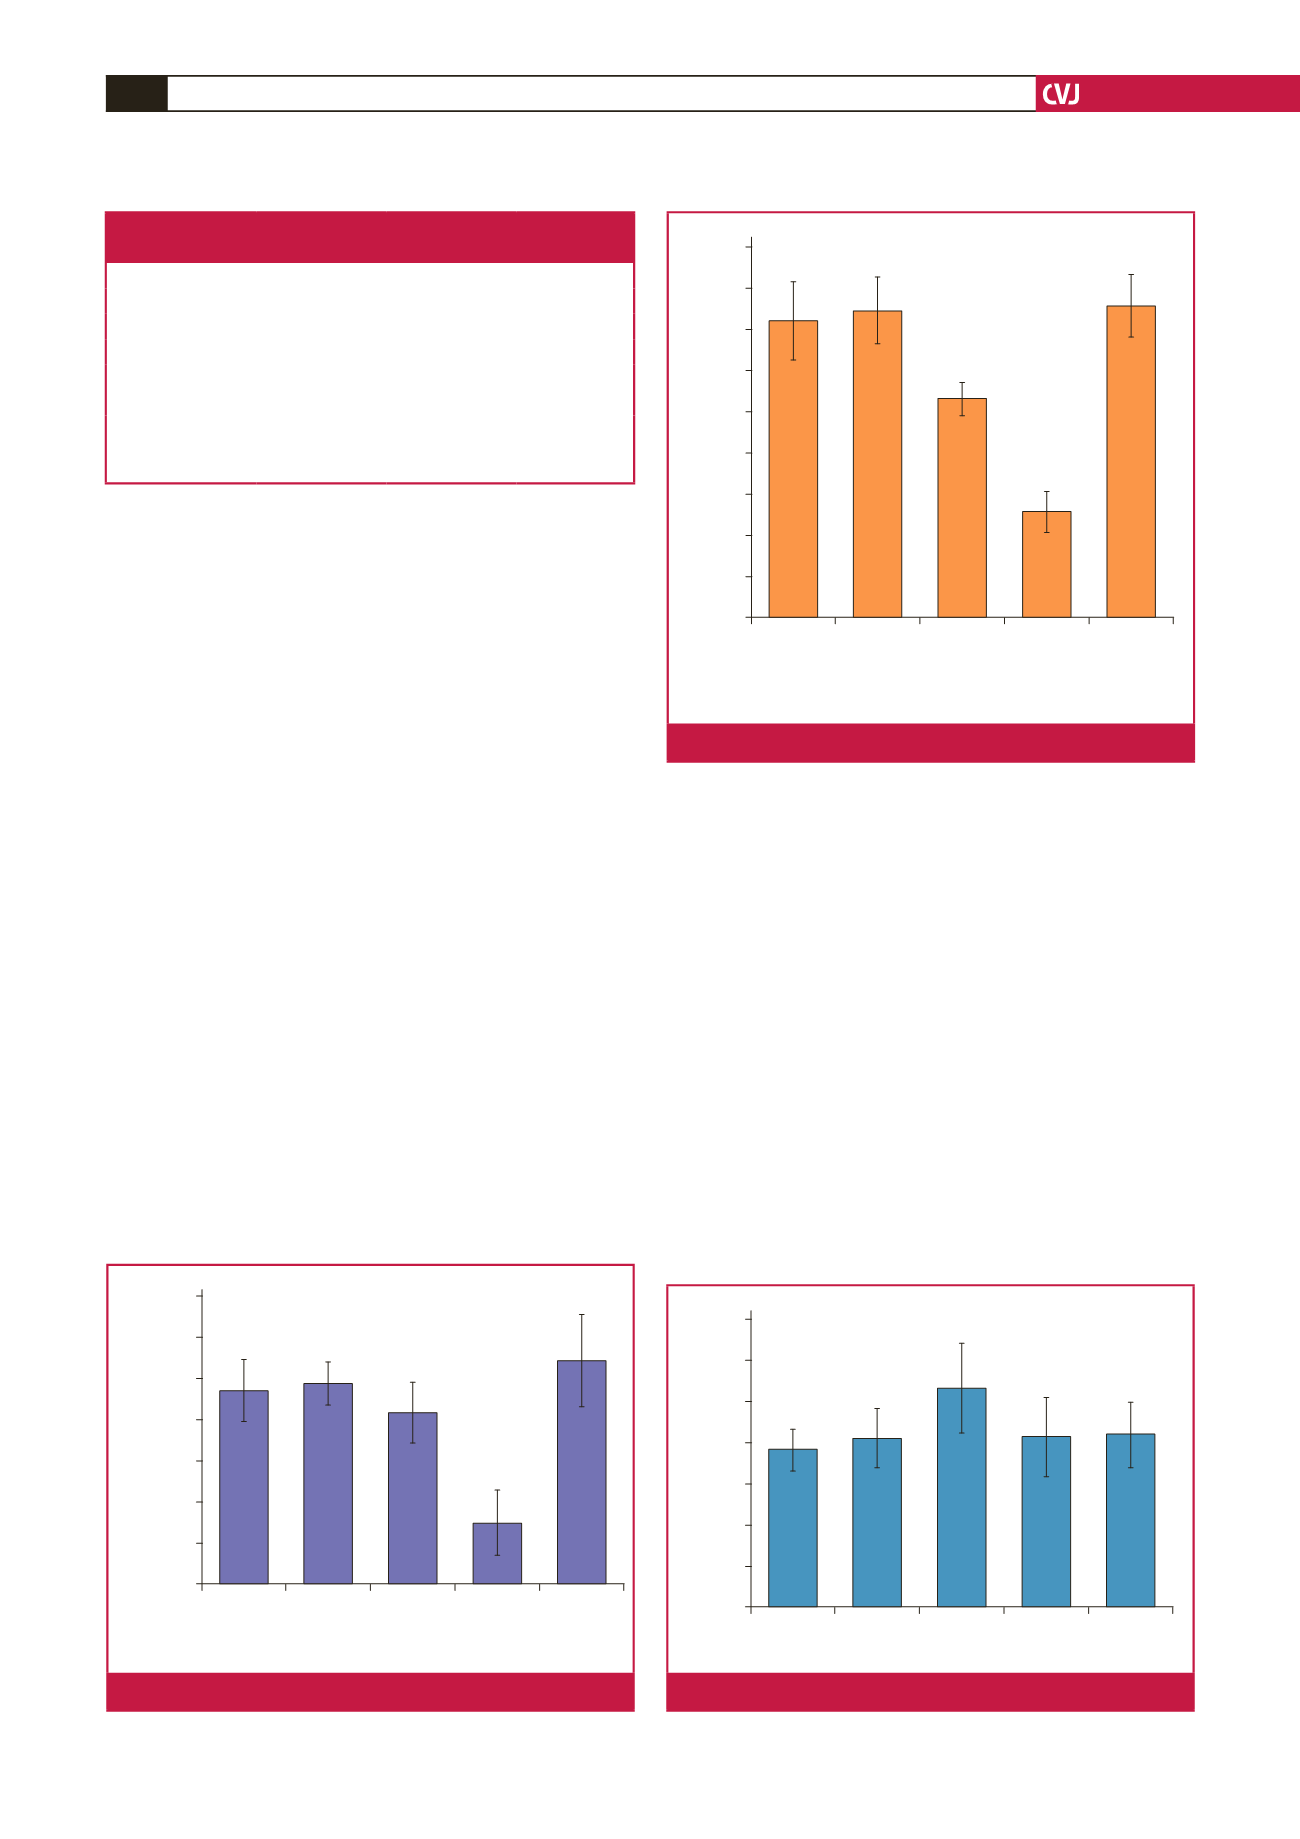
C
Na
and GFR values were lower in the RSV-E group and these
findings were attributed to the RSV eluent (20% ethanol), which
Table 6. Sodium clearance rate (C
Na
), glomerular filtration rate
(GFR) and fractional sodium excretion (%FE
Na
) values
Groups (
n
=
7)
C
Na
(ml/min) GFR (ml/min)
%FE
Na
Control
0.0047
±
0.0007
γ
1.25
±
0.19
γ
0.38
±
0.04
L-NNA
0.0049
±
0.0005
γ
1.30
±
0.16
γβ
0.42
±
0.07
RSV50
0.0042
±
0.0007
γ
0.87
±
0.08
γ
0.53
±
0.11
RSV-E
0.0015
±
0.0007 0.32
±
0.09*
β
0.41
±
0.09
L-NNA
+
RSV50 0.0055
±
0.001
γ
1.33
±
0.14
γβ
0.42
±
0.08
*Compared to the control group,
p
<
0.05;
α
compared to the L-NNA
group,
p
<
0.05;
β
compared to the RSV50 group,
p
<
0.05;
γ
compared
to the RSV-E group,
p
<
0.05.
Control
L-NNA RSV50 RSV-E L-NNA +
RSV50
0.0070
0.0060
0.0050
0.0040
0.0030
0.0020
0.0010
0.0000
Sodium clearnace rate (ml/min)
α
α
Compared to other groups,
p
<
0.05
Fig. 3.
Sodium clearance values of the study groups.
Control
L-NNA RSV50 RSV-E L-NNA +
RSV50
1.60
1.40
1.20
1.00
0.80
0.60
0.40
0.20
0.00
Glomerular filtration rate (ml/min)
βγ
βγ
β
γ
γ
β
Compared to RSV50 group,
p
<
0.05
γ
Compared to RSV-E group,
p
<
0.05
Fig. 4.
Glomerular filtration rates of the study groups.
Control
L-NNA RSV50 RSV-E L-NNA +
RSV50
0.7
0.6
0.5
0.4
0.3
0.2
0.1
0
Fractional sodium excretion (%)
Fig. 5.
Fractional sodium excretion values of the study groups.