


 26 / 74

CARDIOVASCULAR JOURNAL OF AFRICA • Volume 28, No 5, September/October 2017
300
AFRICA
Plasma levels of oxLDL were measured by ELISA using a
specific ELISA kit (MBS729489, My BioSource Ltd, USA). The
coefficient of variation for the assay was 4.4 to 5.6. The coated
monoclonal antibody (mAb) was against a conformational
epitope in the apolipoprotein B-100 (apoB-100) moiety of LDL.
All procedures were carried out according to the manufacture’s
instruction.
Briefly, the mAb-coated wells were loaded with 50 µl standards
or samples. In order to determine quantitative amounts of
oxLDL in the sample, polyclonal antibody (conjugated to
horseradish peroxidase) specific for oxLDL, was added to
each well. The wells underwent washing three times with PBS
following incubation for one hour at room temperature. TMB
substrate solution was then added and allowed to react for 20
minutes. The chromogenic reaction was halted by adding the
stop solution. The absorbance of the wells was read using a
spectrophotometer (Awareness, USA) at 450 nm. The amount
of oxLDL concentration in each sample was determined using a
standard curve (
x
=
concentration and
y
=
optical density).
Statistical analysis
The required sample sizes were obtained based on a previous
article so no statistical methods were used to determine sample
sizes.
26
Resultant data are presented as means
±
standard
deviation (SD). The means of the variables and the differences in
mean values between the groups were evaluated using the Mann–
Whitney
U
-test. A
p-
value of
<
0.05 was considered significant.
Results
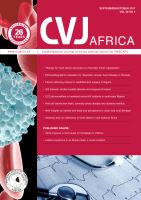
We intended to determine perturbations in the plasma lipid
profile of the rats in each group to confirm the induction of
hypercholesterolaemia after 20 weeks of treatment. As shown in
Fig. 1, the serum total cholesterol levels of the HD group were
approximately three-fold higher than those of the ND group
[229.35
±
13.26 vs 67.89
±
5.14 mg/dl (5.94
±
0.34 vs 1.76
±
0.13
mmol/l);
p
<
0.01]. The serum levels of LDL-C in the HD group
were more than 10-fold higher than those in the ND group
[177.39
±
10.38 vs 15.20
±
2.34 mg/dl (4.59
±
0.27 vs 0.39
±
0.06
mmol/l);
p
<
0.05]. A slight but non-significant decrease was also
observed in HDL-C levels [31.27
±
4.69 vs 33.66
±
2.90 mg/dl
(0.81
±
0.12 vs 0.87
±
0.08 mmol/l);
p
=
ns].
The cholesterol-lowering activity of AV was also evaluated.
As shown in Fig. 1, AV displayed a strong cholesterol-lowering
activity at a dose of 20 mg/kg. Serum levels of total cholesterol in
the HD
+
AV group decreased approximately 50% in comparison
with those of the HD group [119.00
±
9.187 vs 229.35
±
13.26
mg/dl (3.08
±
0.24 vs 5.94
±
0.34 mmol/l);
p
<
0.01]. The serum
levels of LDL-C in the HD
+
AV group decreased 75% in
comparison to those of the HD group [44.284
±
6.905 vs 177.398
±
10.386 mg/dl (1.15
±
0.18 vs 4.59
±
0.27 mmol/l);
p
<
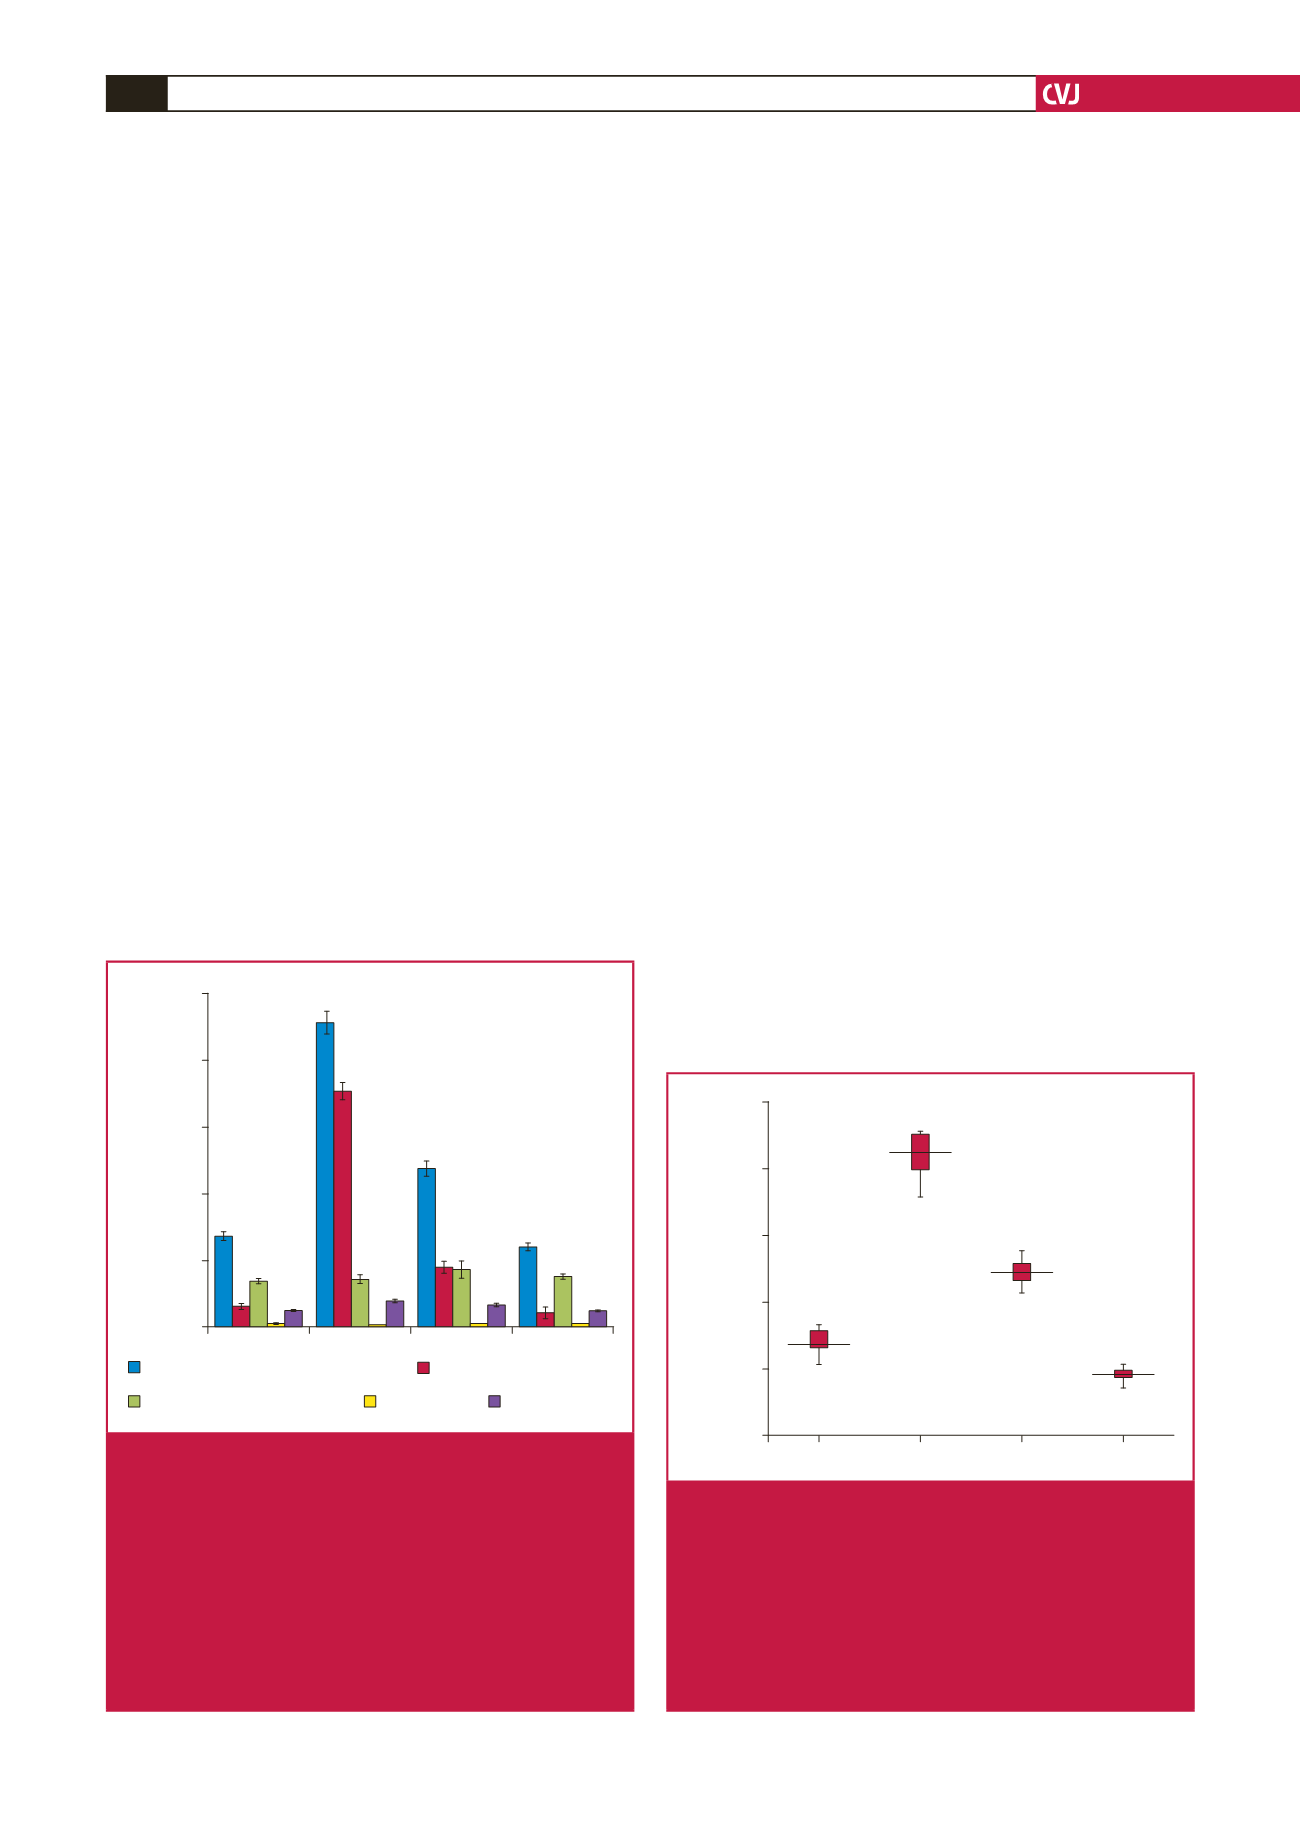
0.01]. The
plasma levels of oxLDL were significantly increased in the HD
versus the ND group [214.42
±
17.46 vs 69.13
±
9.92 mg/dl (5.55
±
0.45 vs 1.79
±
0.26 mmol/l);
p
<
0.01] but AV diminished the
plasma levels of oxLDL in the HD
+
AV group compared to the
AV group [126.52
±
9.46 vs 214.42
±
17.46 mg/dl (3.28
±
0.25 vs
5.55
±
0.45 mmol/l)] (Fig. 2).
The protein expression of cleaved caspase-3 and bcl-2, and
phosphorylation of p38 were determined to ascertain whether
cholesterol induced apoptosis. The protein expression levels of
cleaved caspase-3 were measured by Western blotting analysis.
Based on the results, cholesterol increased the cleavage of caspase-3
ND
HD
HD + AV
AV
mg/dl
250
200
150
100
50
0
Total serum cholesterol (mg/dl)
LDL-cholesterol (mg/dl)
HDL-cholesterol (mg/dl)
HDL/LDL
VLDL (mg/dl)
**
**
*
##
## #
Fig. 1.
Bar graph showing the attenuating effect of adminis-
tration of oral atorvastatin (20 mg/kg for eight weeks)
on cholesterol-induced serum lipid profiles of triglyc-
erides (TG), total cholesterol (TC), HDL-C and LDL-C
in hypercholesterolaemic rats. Data are presented as
mean
±
SD;
n
=
10. *
p
<
0.05, **
p
<
0.001 compared
with normal diet group;
#
p
<
0.05,
##
p
<
0.001 compared
with hypercholesterolaemic rats using the ANOVA test.
ND
=
normal diet, HD
=
high-cholesterol (2%) diet, HD
+
AV
=
high-cholesterol diet plus AV (20 mg/kg), and
AV
=
AV control group.
ND
HD
HD + AV
AV
Serum-ox (ng/dl)
250
200
150
100
50
0
Fig. 2.
Box plot showing the reducing effect of admin-
istration of oral atorvastatin (20 mg/kg for eight
weeks) on cholesterol-induced plasma oxLDL levels.
Data are presented as mean
±
SD;
n
=
10. **
p
<
0.001 compared with normal diet group;
##
p
<
0.001
compared with hypercholesterolaemic rats using the
ANOVA test. ND
=
normal diet, HD
=
high-cholesterol
(2%) diet, HD
+
AV
=
high-cholesterol diet plus AV (20
mg/kg ) and AV
=
AV control group.