


 38 / 74

CARDIOVASCULAR JOURNAL OF AFRICA • Volume 28, No 5, September/October 2017
312
AFRICA
of 10.3%, in patients with femur fracture. Lower RV GLS values
and longer hospital stay were good predictors for detecting
pulmonary complications. In addition, our findings document
that patients with impaired RV GLS values
>
–14.85% had
significantly lower clinical event-free survival rates than patients
with better RV GLS values.
After long-bone trauma, medullary fat enters the systemic
circulation and fat emboli pass through the pulmonary capillaries,
causing altered pulmonary haemodynamics and a systemic
inflammatory reaction.
1,2
Hormonal changes after trauma can
also cause damage to the pulmonary capillary beds, causing
altered pulmonary haemodynamics in animal models.
4
Previous studies have demonstrated that when increased
pulmonary vascular resistance is caused by vascular obstruction
from fat emboli, RV afterload may increase and RVEF will
decline.
16-18
RV function reflects not only RV myocardial
contractility but also the afterload effect of pulmonary vascular
pathology.
19
To our knowledge, no previous study has reported
on the effects of femur fracture on pulmonary haemodynamics
and RV function.
RV dysfunction has been shown to predict adverse clinical
outcomes in patients with heart failure ormyocardial infarction,
5,20
therefore quantifying RV dysfunction would contribute to
identifying at-risk patients, monitoring the effects of medical
management and predicting clinical outcomes. However, it
is difficult to assess RV function accurately using standard
two-dimensional echocardiography imaging because the RV
chamber has a complex shape.
9
RV FAC and TAPSE have been
established as echocardiographic parameters for assessing RV
contractility or systolic function,
9
and predicting adverse clinical
events in patients with pulmonary embolism and myocardial
infarction.
21,22
Although the imaging quality has improved, delineation
of the endocardial border for the measurement of RV FAC
has variable reliability depending on the experience of the
operator. In addition, velocity and displacement-based analyses,
such as TAPSE, can be affected by tethering and cardiac
translation and respiratory variation.
9,23
Therefore, detecting
subclinical RV dysfunction may be limited using conventional
two-dimensional echocardiographic measurements. In our
study, echocardiographic measures of RV function, including
TAPSE and RV FAC, did not differ significantly with outcome;
we did not detect differences in subclinical RV dysfunction
between the group with pulmonary complications and that
with no complications using conventional two-dimensional
echocardiographic measures.
Two-dimensional strain echocardiography quantifies both
regional and global myocardial function.
24
Notably, detecting RV
dysfunction using two-dimensional strain analysis can provide
additional prognostic information and better predict outcomes
than other traditional echocardiographic parameters in patients
with myocardial infarction, pulmonary artery hypertension
and heart failure.
24,25
Because the RV muscle fibres are arranged
longitudinally, most RV systolic function and RV stroke volume
is generated by longitudinal shortening.
26
Therefore, RV GLS
is correlated with RV systolic function. A previous study
demonstrated that RV GLS, including the interventricular
septum and RV free wall, correlated significantly with RVEF
based on cardiac magnetic resonance imaging.
27
The reference value of RV GLS in normal subjects is about
–28%,
14,15
and the absolute values of RV GLS in our study patients
were lower than the reference value. Relatively older age, altered
pulmonary haemodynamics and decreased RV function due to
100 – Specificity (%)
0
20
40
60
80
100
Sensitivity (%)
100
80
60
40
20
0
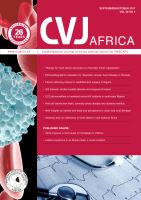
Area under curve
RV GLS: 0.728, 95% CI = 0.524–0.932
Fig. 1.
Receiver operating characteristic (ROC) curve analy-
sis for the detection of pulmonary complications. The
best cut-off value of RV GLS for the prediction of
pulmonary complications was –14.85% (area under
the curve: 0.728,
p
=
0.036). In patients with femur
fracture, this value had a sensitivity of 75.0% and a
specificity of 62.9% for correctly predicting pulmonary
complications. CI, confidence interval, RV GLS, right
ventricular global longitudinal strain.
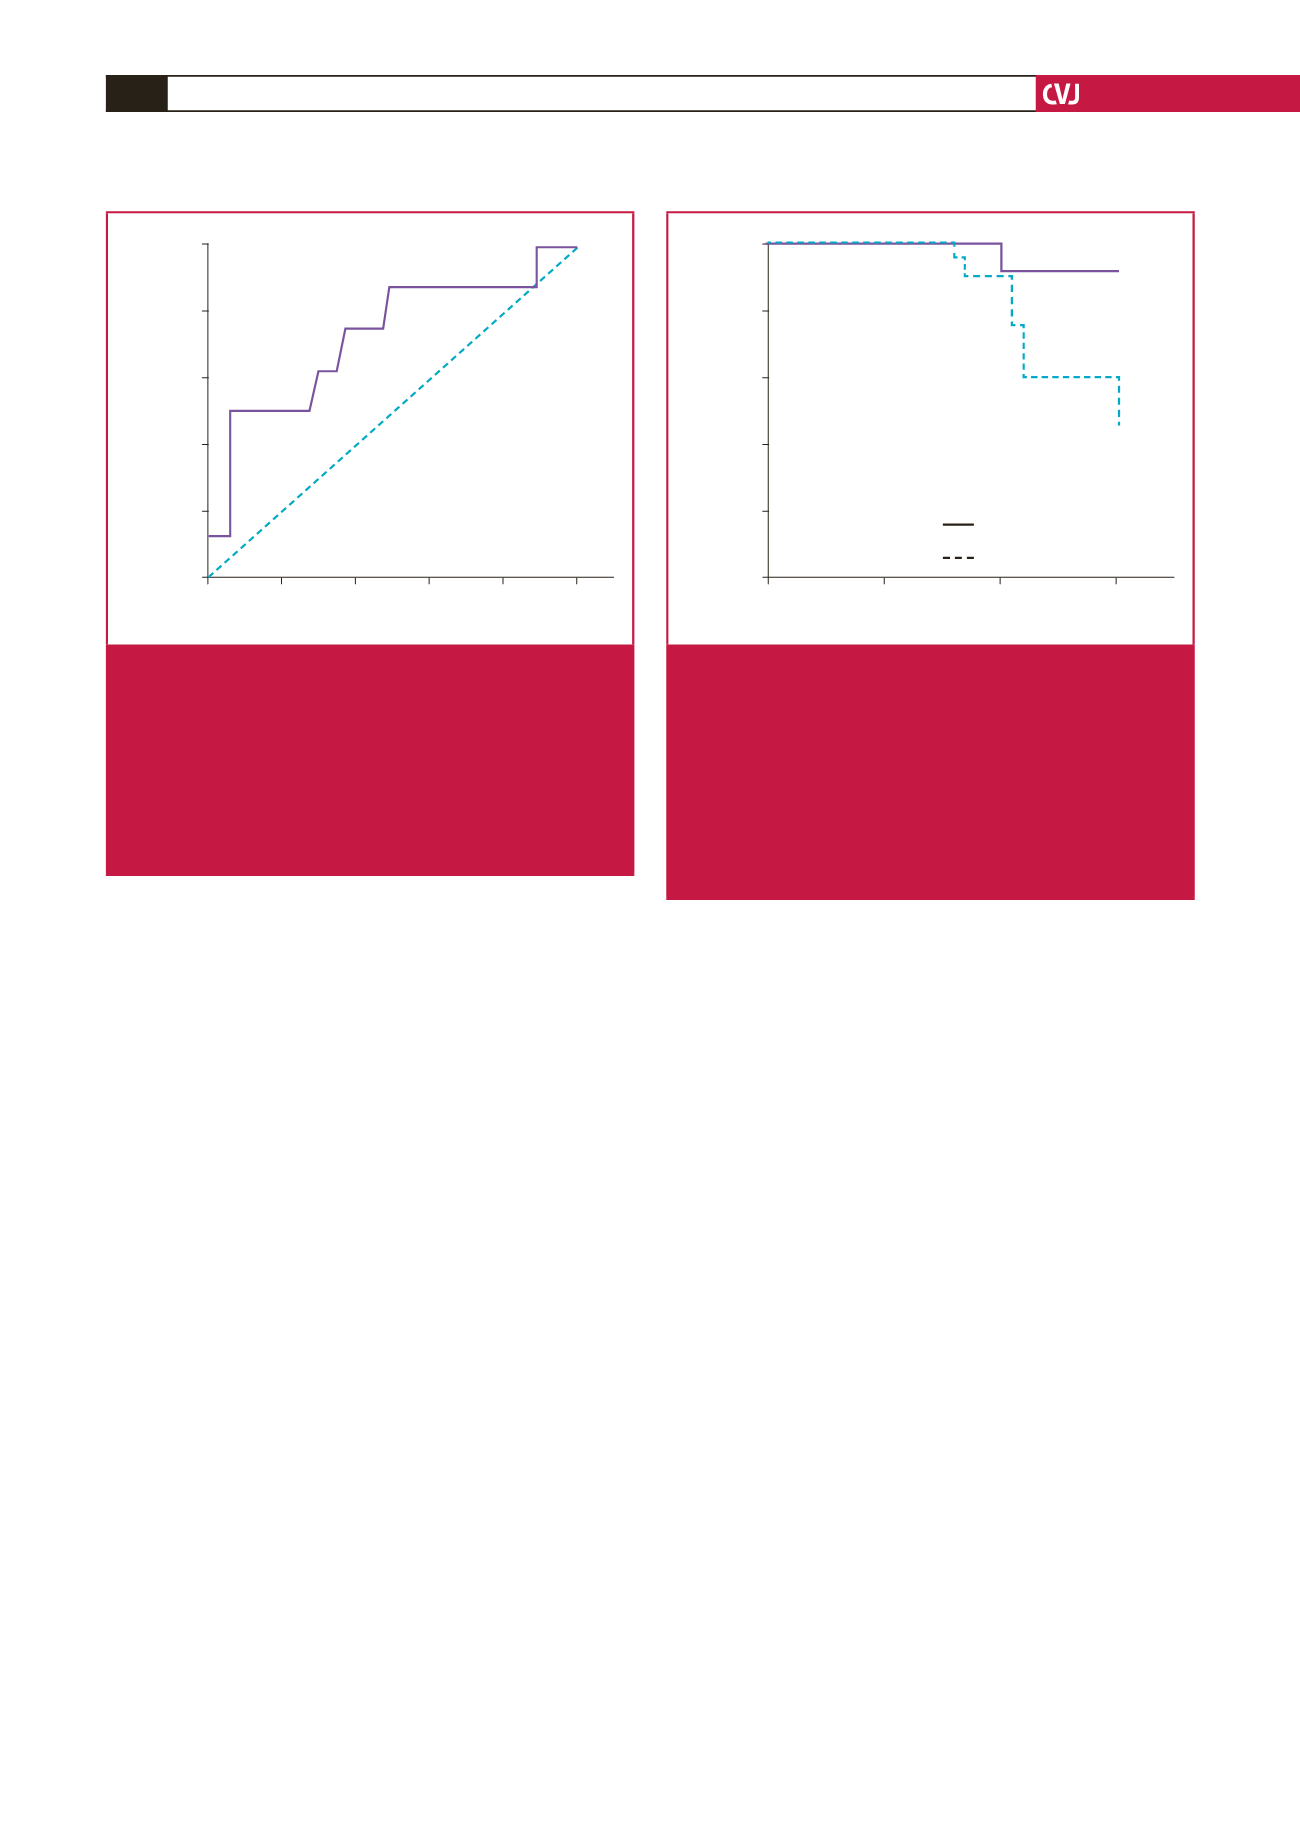
Days
0
10
20
30
Event-free survival (%)
100
80
60
40
20
0
p
= 0.027
RV GLS
≤
–14.85%
RV GLS
>
–14.85%
Fig. 2.
Clinical event-free survival curves based on Kaplan–
Meier analysis. Patients were categorised into two
groups: RV GLS
>
–14.85% and RV GLS
≤
–14.85%.
The cumulative pulmonary complication-free survival
rates of the two groups were compared using Kaplan–
Meier survival curves and the log-rank test. Patients
with RV GLS values
>
–14.85% had a significantly
higher rate of pulmonary complications during the
first postoperative month (
p
=
0.027). RV GLS, right
ventricular global longitudinal strain.