


 47 / 74

CARDIOVASCULAR JOURNAL OF AFRICA • Volume 28, No 5, September/October 2017
AFRICA
321
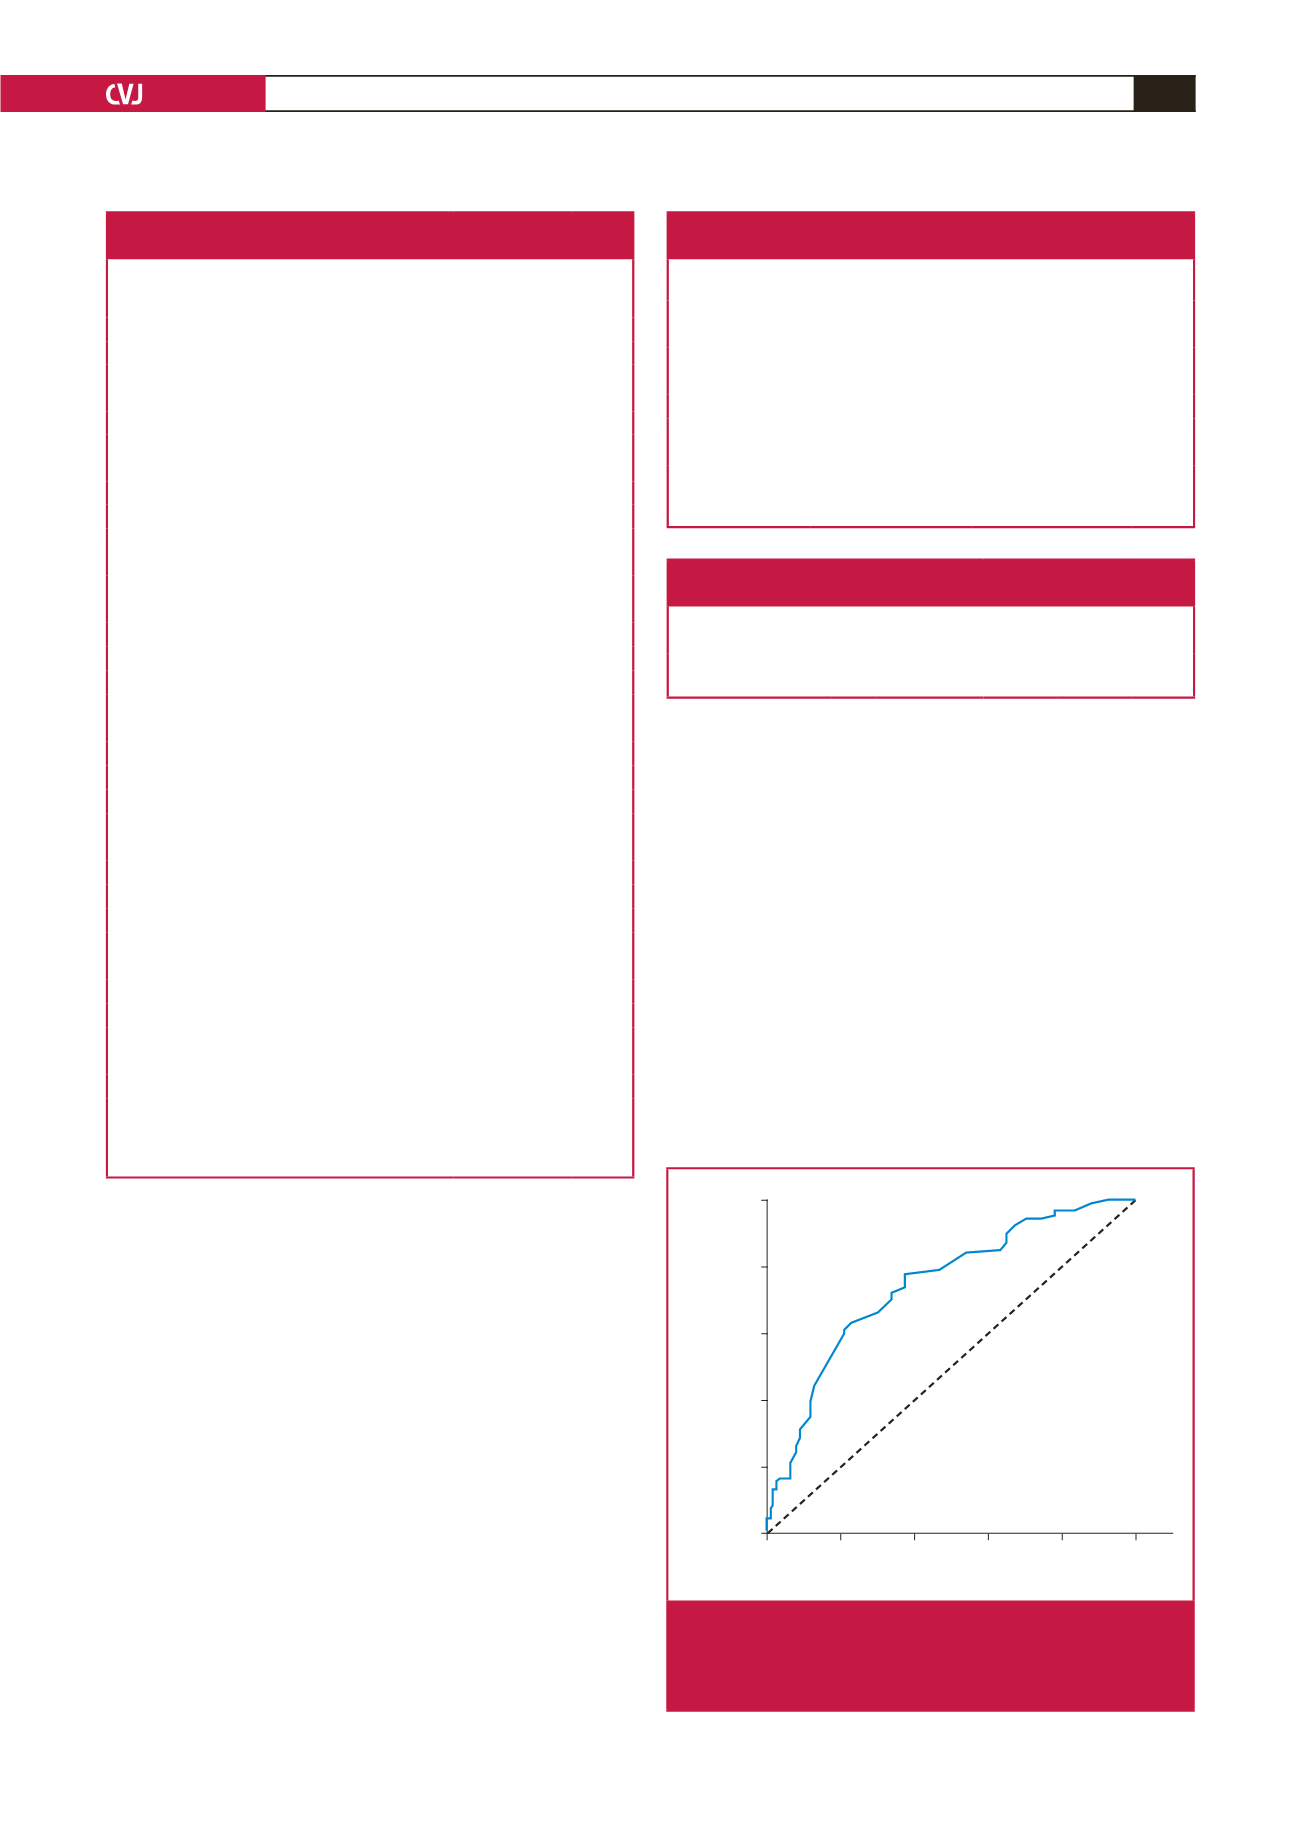
0.001) (Table 4, Fig. 1). RDW was positively correlated with
Gensini score, obstructive CAD and triple-vessel disease (
r
=
0.468,
r
=
0.409 and
r
=
0.332, respectively and
p
<
0.001 for all).
Discussion
This study showed an association between RDW and CAD in
diabetic patients. RDW values were found to be higher in the
diabetic CAD population and higher RDW values were related
to more extensive and complex coronary lesions.
RDW is a marker of the variation in size of red blood cells
circulating in the body, which reflects the value of anisocytosis.
1
It is routinely reported during automated complete blood
counts. An elevation in RDW values may be seen in patients
with ineffective erythropoiesis (iron, vitamin B
12
or folic acid
deficiency and various haemoglobinopathies), recent blood
transfusions and haemolysis.
15
In daily practice it is commonly
used to narrow the differential diagnosis of anaemia.
2
The growing attention given to the relationship between RDW
and cardiovascular events was first spurred on by the report
from Felker
et al
., which concluded that there was a strong and
independent association between RDW and the risk of adverse
outcomes in heart failure patients.
16
Subsequently, Tonelli
et al
.
predicted an independent relationship between RDW and the
risk of cardiovascular death in patients with CAD.
3,16
Following
the direction of these studies, researchers reported that higher
RDW values were also associated with a worse prognosis in
peripheral artery disease and even in the unselected population.
5,6
Several explanations could be postulated in order to explain
the underlying mechanisms that may contribute to a worse
prognosis among patients with cardiovascular disease. However
the reason for the poor prognosis remains unclear.
It has not been determined yet whether RDW is a marker of
the severity of various disorders or if there is direct link between
anisocytosis and poor prognosis in patients with CAD. Factors
Table 2. Baseline characteristics and laboratory
findings of low and high RDW groups
Variables
Low RDW
(
≤
13.25)
(
n
=
46)
High RDW
(
>
13.25)
(
n
=
78)
p-
value
Age (years)
56.7
±
8.0
58.2
±
9.5
0.381
Gender (male)
27 (59)
41 (53)
0.318
Hypertension
38 (83)
66 (85)
0.478
Dyslipidaemia
29 (63)
48 (61)
0.511
Smoking
5 (11)
19 (24)
0.052
Aspirin
33 (72)
60 (77)
0.331
Clopidogrel
11 (24)
12 (15)
0.173
RAS blockers
32 (70)
61 (78)
0.195
β
-blockers
28 (61)
38 (49)
0.130
Calcium channel blockers
9 (20)
14 (18)
0.501
Statins
13 (28)
30 (39)
0.169
Body mass index (kg/m
2
)
28.8
±
4.5
28.0
±
4.5
0.363
Systolic blood pressure (mmHg)
131
±
13
133
±
15
0.328
Diastolic blood pressure (mmHg)
78
±
8
79
±
8
0.196
Glucose (mg/dl)
163
±
77
181
±
79
0.207
[mmol/l]
[9.05
±
4.27]
[10.05
±
4.38]
Creatinine (mg/dl)
0.63
±
0.17
0.76
±
0.31 0.008
[μmol/l]
[55.69
±
15.03]
[67.18
±
27.40]
Uric acid (mg/dl)
4.6
±
1.5
5.1
±
1.7
0.213
hs-CRP (mg/l)
4.11
±
1.88
7.12
±
5.58 0.043
Total cholesterol (mg/dl)
195
±
44
202
±
52
0.481
[mmol/l]
[5.05
±
1.14]
[5.23
±
1.09]
Triglycerides (mg/dl)
197
±
173
188
±
114 0.736
[mmol/l]
[2.23
±
1.95]
[2.12
±
1.29]
LDL cholesterol (mg/dl)
114
±
33
127
±
48
0.088
[mmol/l]
[2.95
±
0.85]
[3.29
±
1.24]
HDL cholesterol (mg/dl)
46
±
15
44
±
12
0.461
[mmol/l]
[1.19
±
0.39]
[1.14
±
0.31]
WBC (10
3
cells/µl)
7.1
±
1.9
7.3
±
2.2
0.516
Haemoglobin (g/dl)
13.3
±
1.5
13.0
±
1.6
0.454
RDW (%)
12.9
±
0.7
14.3
±
1.4
0.001
MPV (fl)
8.35
±
1.13
8.72
±
0.93 0.049
Neutrophil/lymphocyte ratio (%)
1.92
±
0.07
2.89
±
2.33 0.009
RDW: red cell distribution width, RAS: renin–angiotensin system, hs-CRP:
high-sensitivity C-reactive protein, LDL: low-density lipoprotein, HDL: high-
density lipoprotein, WBC: white blood cells, MPV: mean platelet volume.
Data are shown as
n
(%) or mean
±
SD
Table 3. Severity of coronary artery disease between
low and high RDW groups
Variables
Low RDW (
≤
13.25)
(
n
=
46)
High RDW (
>
13.25)
(
n
=
78)
p-
value
Gensini score
Total
11 [4–31]
43 [16–73]
<
0.001
LAD
5 [3–12]
18 [5-30]
0.001
Cx
3 [1–5]
7 [3–19]
<
0.001
RCA
2 [1–3]
7 [2–18]
<
0.001
Obstructive CAD
23 (50)
63 (81)
0.001
Triple-vessel disease
2 (4)
26 (33)
<
0.001
RDW: red cell distribution width, LAD: left anterior descending coronary
artery, Cx: circumflex coronary artery, RCA: right coronary artery, CAD: coro-
nary artery disease. Data are shown as
n
(%) or median [interquartile range].
Table 4. Diagnostic accuracy of red cell distribution
width for coronary artery disease
Variable Cut-off value AUC 95% CI of AUC Sensitivity Specificity
p-
value
a
RDW (%)
>
13.25 0.742 0.679–0.806 0.629
0.771
<
0.001
AUC: area under the receiver operating characteristic curve, CI: confidence
interval, RDW: red cell distribution width.
a
Significance level of AUC.
1 – Specificity
0.0
0.2
0.4
0.6
0.8
1.0
Sensitivity
1.0
0.8
0.6
0.4
0.2
0.0
– : RDW (%)
Fig. 1.
Receiver operating characteristic curve showing the
relationship between sensitivity and false positivity at
various cut-off points for red cell distribution width to
predict coronary artery disease.