


 52 / 74

CARDIOVASCULAR JOURNAL OF AFRICA • Volume 28, No 5, September/October 2017
326
AFRICA
Results
Among the 1 000 individuals included in the Dakar sample, 16
women were excluded because they reported pregnancy. Similarly,
four women of the Tessekere sample were also excluded for
pregnancy. Analyses were finally performed on a sample of
984 Dakarites and 496 Tessekere dwellers. The distributions of
height, weight, BMI, WC, WHR, general and central obesity,
sociodemographic variables, and comparisons between males and
females in both environments are summarised in Table 1. The
results show that men and women differed for all the factors studied
except for age in both environments, and for WHR in Dakar.
In Dakar, the prevalence of underweight, overweight and
general obesity in terms of BMI was 12.6% (95% CI: 10.5–14.7),
19.2% (95% CI: 16.7–21.7) and 9.7% (95% CI: 7.9–11.5),
respectively. The prevalence of central obesity was 26.0% (95%
CI: 23.3–28.7) using WC, and 39.9% (95% CI: 36.8–43.0) using
WHR (Table 2).
In Tessekere, the prevalence of underweight, overweight and
general obesity in terms of BMI was 29.6% (95% CI: 25.6–
33.6), 13.3% (95% CI: 10.3–16.3) and 2.8% (95% CI: 1.3–4.3),
respectively. The prevalence of central obesity was 11.9% (95%
CI: 9.1–14.7) using WC, and 23.6% (95% CI: 19.9–27.3) using
WHR (Table 2).
Dakar residents were more often overweight and obese and
less often thin than the Tessekere inhabitants [
χ
² (3 df)
=
80.9;
p
<
0.001]. Likewise, they showed higher central obesity rates than
the Tessekere inhabitants [WC:
χ
² (1 df)
=
39.3,
p
<
0.001; WHR:
χ
² (1 df)
=
39,
p
<
0.001].
In Dakar as in Tessekere, bivariate analyses showed that
all the sociodemographic factors studied were associated with
general and central obesity (Table 3). The prevalence of general
and central obesity rose gradually with age in both environments,
except for obesity based on WC in Tessekere, which reached its
highest rate among people between the ages of 40 and 49 years.
In the urban and rural areas studied, general obesity affected
women six times more often than men, and their WC exceeded
the threshold of obesity 11 times and 18 more often than men in
Dakar and Tessekere, respectively.
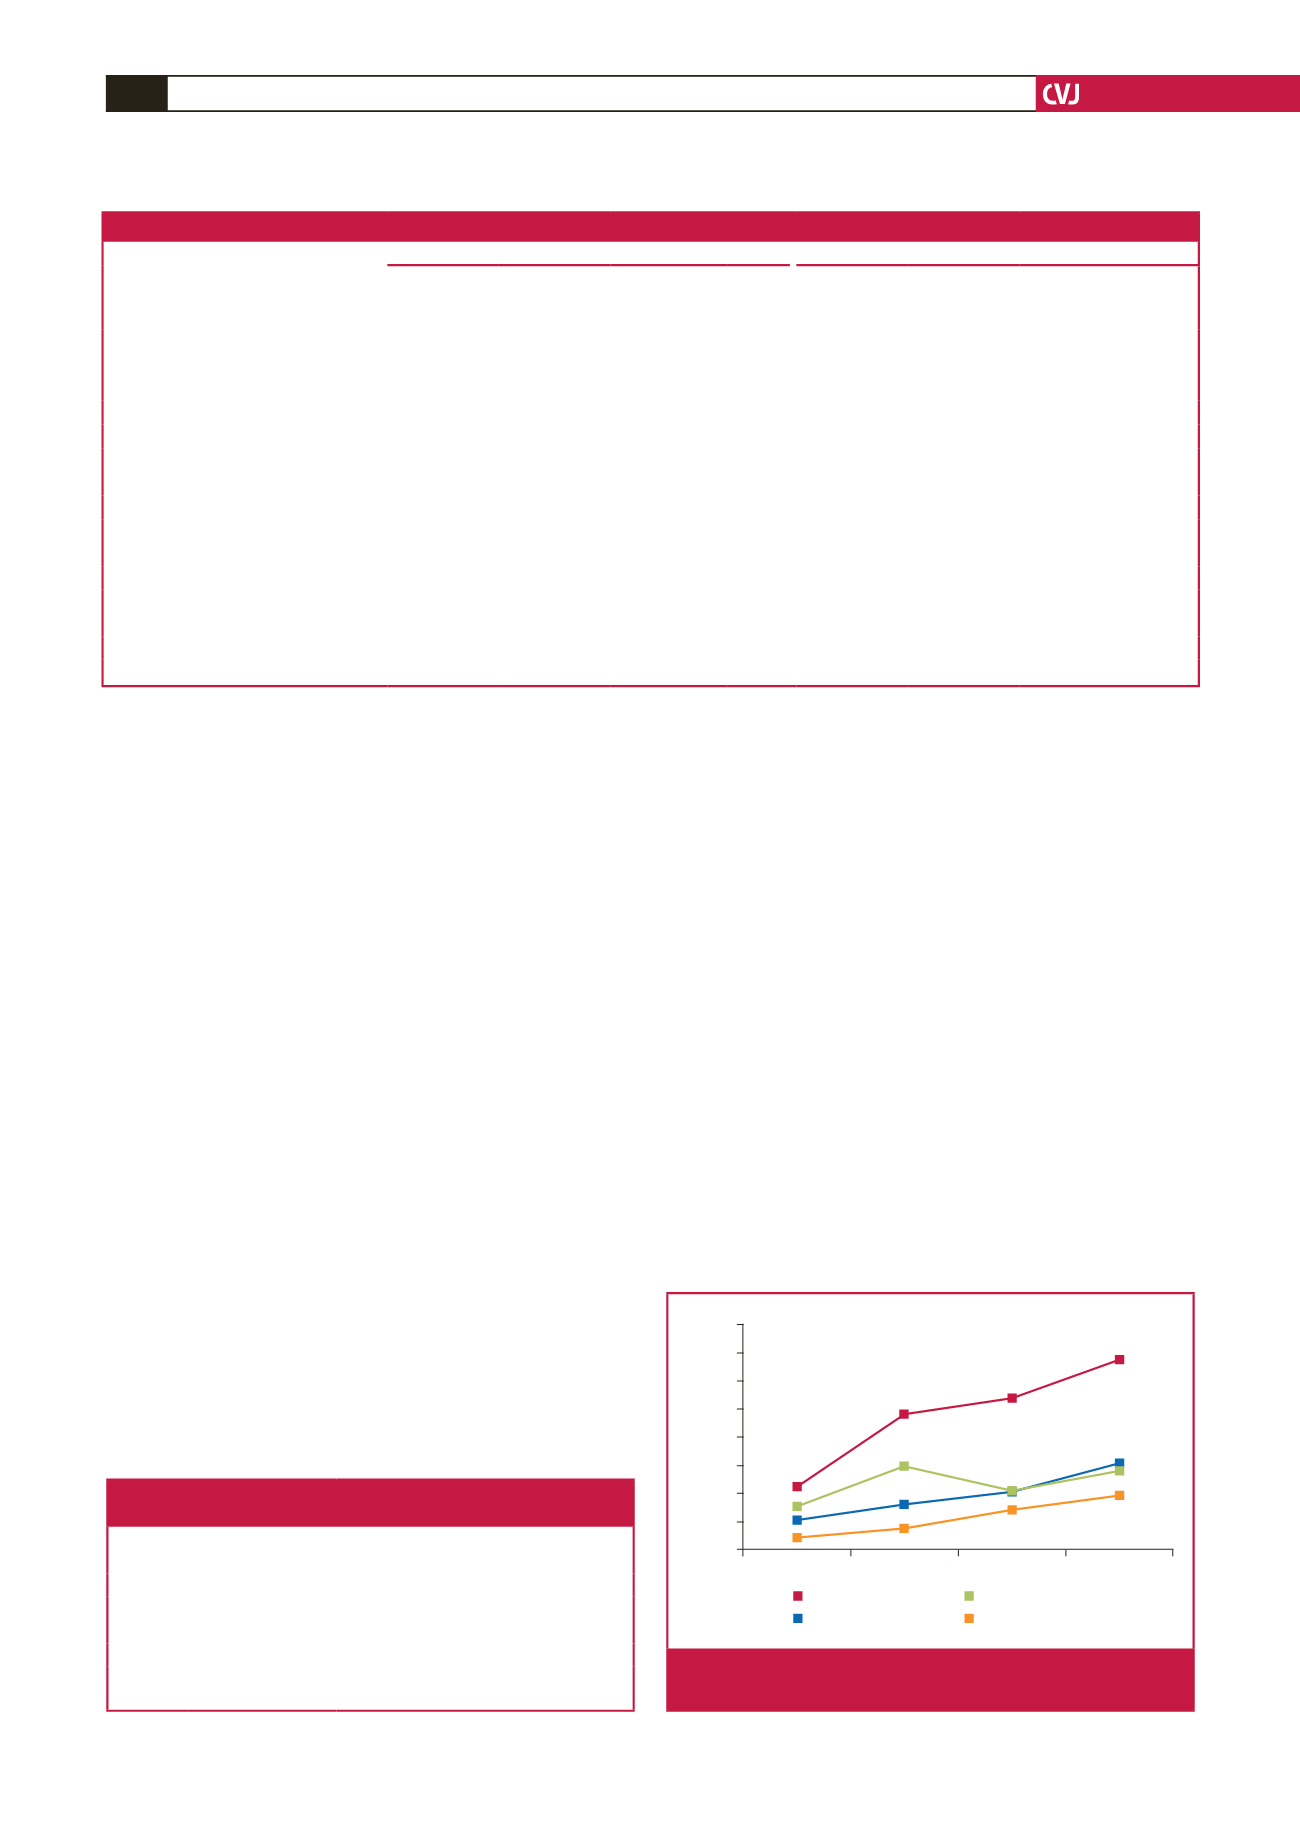
As shown in Fig. 1, the prevalence of overweight/obesity
(using BMI) rose with age among men and women in Dakar. The
same pattern was observed among men in Tessekere. However,
among rural women, the prevalence of overweight/obesity
reached its highest rate between the ages of 30 and 39 years.
Multivariate analyses showed that age and gender were
the primary risk factors for overweight/obesity in Dakar and
Tessekere (Table 4). Educational level also showed significant
associations with BMI
≥
25 kg/m², but only in the urban area,
where people with between one and eight years of schooling
had greater chances of being overweight or obese than people
Table 1. Demographic and anthropomatic characteristics of the sample
Characteristics
Dakar
Tessekere
Total
(
n
=
984)
Male
(
n
=
494)
Female
(
n
=
490)
p
-value
Total
(
n
=
496)
Male
(
n
=
241)
Female
(
n
=
255)
p
-value
Age (years)
35.70 ± 13.16 35.89 ± 13.27 35.51 ± 13.07 0.652 37.33 ± 15.25 37.26 ± 15.45 37.40 ± 15.08 0.917
Height (cm)
172.56 ± 9.87 178.96 ± 8.07 166.11 ± 6.88
<
0.001 169.63 ± 10.38 175.85 ± 8.09 163.75 ± 8.77
<
0.001
Weight (kg)
69.28 ± 14.44 70.21 ± 16.67 68.34 ± 16.00 0.043 60.25 ± 12.32 62.38 ± 11.26 58.23 ± 12.96
<
0.001
BMI (kg/m²)
23.33 ± 4.89 21.91 ± 3.54 24.76 ± 5.59
<
0.001 20.97 ± 4.07 20.15 ± 3.24 21.74 ± 4.60
<
0.001
General obesity,
n
(%)
95 (9.7)
14 (2.8)
81 (16.5)
<
0.001
14 (2.8)
2 (0.8)
12 (4.7)
0.009
WC (cm)
84.31 ± 13.02 81.51 ± 10.65 87.14 ± 14.51
<
0.001 77.25 ± 10.59 76.13 ± 9.31 78.32 ± 11.59 0.021
Central obesity by WC,
n
(%)
256 (26)
21 (4.3)
235 (48)
<
0.001
59 (11.9)
3 (1.2)
56 (22.?)
<
0.001
WHR
0.836 ± 0.081 0.837 ± 0.069 0.834 ± 0.092 0.579 0.839 ± 0.079 0.847 ± 0.075 0.831 ± 0.082 0.019
Central obesity by WHR,
n
(%)
393 (39.9)
83 (16.8)
310 (63.3)
<
0.001
117 (23.6)
17 (7.1)
100 (39.2)
<
0.001
Educational level (Dakar/Tessekere),
n
(%)
<
0.001
0.006
None/none
208 (21.1)
84 (27)
124 (25.3)
373 (75.2)
168 (69.7)
205 (80.4)
Primary/1 year or +
348 (35.5)
163 (33)
185 (37.8)
123 (24.8)
73 (30.3)
50 (19.6)
Intermediate
197 (20)
109 (22.1)
88 (18)
Secondary
91 (9.2)
51 (10.3)
40 (8.2)
University
140 (14.2)
87 (17.6)
53 (10.8)
BMI: body mass index, WC: waist circumference, WHR: waist–hip ratio.
Table 2. Prevalence (%) of underweight, overweight, general obesity
and central obesity by place of residence
Criterion
Category
Dakar
Tessekere
BMI
Underweight
12.6 (10.5–14.7)
29.6 (25.6–33.6)
Overweight
19.2 (16.7–21.7)
13.3 (10.3–16.3)
General obesity
9.7 (7.9–11.5)
2.8 (1.3–4.3)
WC
Central obesity
26.0 (23.3–28.7)
11.9 (9.1–14.7)
WHR
Central obesity
39.9 (36.8–43.0)
23.6 (19.9–27.3)
BMI: body mass index, WC: waist circumference, WHR: waist-hip ratio.
In brackets: 95% confidence limits.
20–29
30–39
40–49
50 and over
% of overweight/obesity
80
70
60
50
40
30
20
10
0
Women in Dakar
Men in Dakar
Women in Tessekere
Men in Tessekere
22.3
10.6
16.1
21.4
48.2
53.9
67.5
30.7
4.0
7.3
14.3
19.6
28.3
20.5
30.0
15.0
Fig. 1.
Age- and gender-specific prevalence (%) of over-
weight/obesity in Dakar and Tessekere.