


 54 / 74

CARDIOVASCULAR JOURNAL OF AFRICA • Volume 28, No 5, September/October 2017
328
AFRICA
Discussion
This study is to our knowledge the first to evaluate the prevalence
of obesity among both men and women in urban and rural
Senegal. Moreover, it is also the first study to assess perception
of body size in both genders in this country.
In Dakar, the prevalence of general obesity was 9.7%, and
that of overweight, 19.2%. These prevalence rates place Dakar
among the West African cities that are least affected by problems
of excess weight.
31,32
Comparison of our results with those of a
study carried out among men and women in Dakar in 2009
11
suggests that prevalence of general obesity may have increased in
the Senegalese capital in five years (17%), but this difference was
not statistically significant. However, since 2009, the prevalence
of central obesity by WC has increased significantly, by 23% (
p
<
0.05). In Tessekere, the prevalence of overweight and obesity
were 13.3 and 2.8%, respectively. Despite the difficulty of making
comparisons with other West African rural areas due to the lack
of current data,
10
these results tend to indicate that Tessekere is
also one of the rural areas in the sub-region that is least affected
by the obesity epidemic.
33-35
BMI
<
16
16
≤
BMI
<
18.5
18.5
≤
BMI
<
20
20
≤
BMI
<
22.5
22.5
≤
BMI
<
25
25
≤
BMI
<
27.5
27.5
≤
BMI
<
30
BMI
>
30
%
100
90
80
70
60
50
40
30
20
10
0
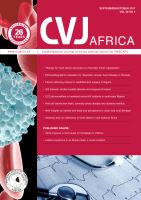
% feel too lean % feel too fat
77.8
67.2
41.1
28.7
15.9
12.1
11.1 8.3
0
40.0
45.8
85.7
0
5.8
0
0
Men in Dakar
BMI
<
16
16
≤
BMI
<
18.5
18.5
≤
BMI
<
20
20
≤
BMI
<
22.5
22.5
≤
BMI
<
25
25
≤
BMI
<
27.5
27.5
≤
BMI
<
30
BMI
>
30
%
100
90
80
70
60
50
40
30
20
10
0
% feel too lean % feel too fat
100
69.0
60.4
28.4
23.1
17.7
9.7 5.2
1.2
40.2
55.2
81.6
6.3
12.7
2.4
0
Women in Dakar
BMI
<
16
16
≤
BMI
<
18.5
18.5
≤
BMI
<
20
20
≤
BMI
<
22.5
22.5
≤
BMI
<
25
25
≤
BMI
<
27.5
27.5
≤
BMI
<
30
BMI
>
30
%
100
90
80
70
60
50
40
30
20
10
0
% feel too lean % feel too fat
64.3
69.6
52.0
44.4
5.0
35.0
13.5 0
0
33.3 50.0
100
0 3.2
0
0
Men in Tessekere
BMI
<
16
16
≤
BMI
<
18.5
18.5
≤
BMI
<
20
20
≤
BMI
<
22.5
22.5
≤
BMI
<
25
25
≤
BMI
<
27.5
27.5
≤
BMI
<
30
BMI
>
30
%
100
90
80
70
60
50
40
30
20
10
0
% feel too lean % feel too fat
63.2
69.1 66.7 66.6
13.5
37.8
29.6
30.8
22.2
33.3
15.4
55.6
6.1 3.3
2.3
5.3
Women in Tessekere
Fig. 2.
Satisfaction with weight by BMI among men and women in Dakar and Tessekere.
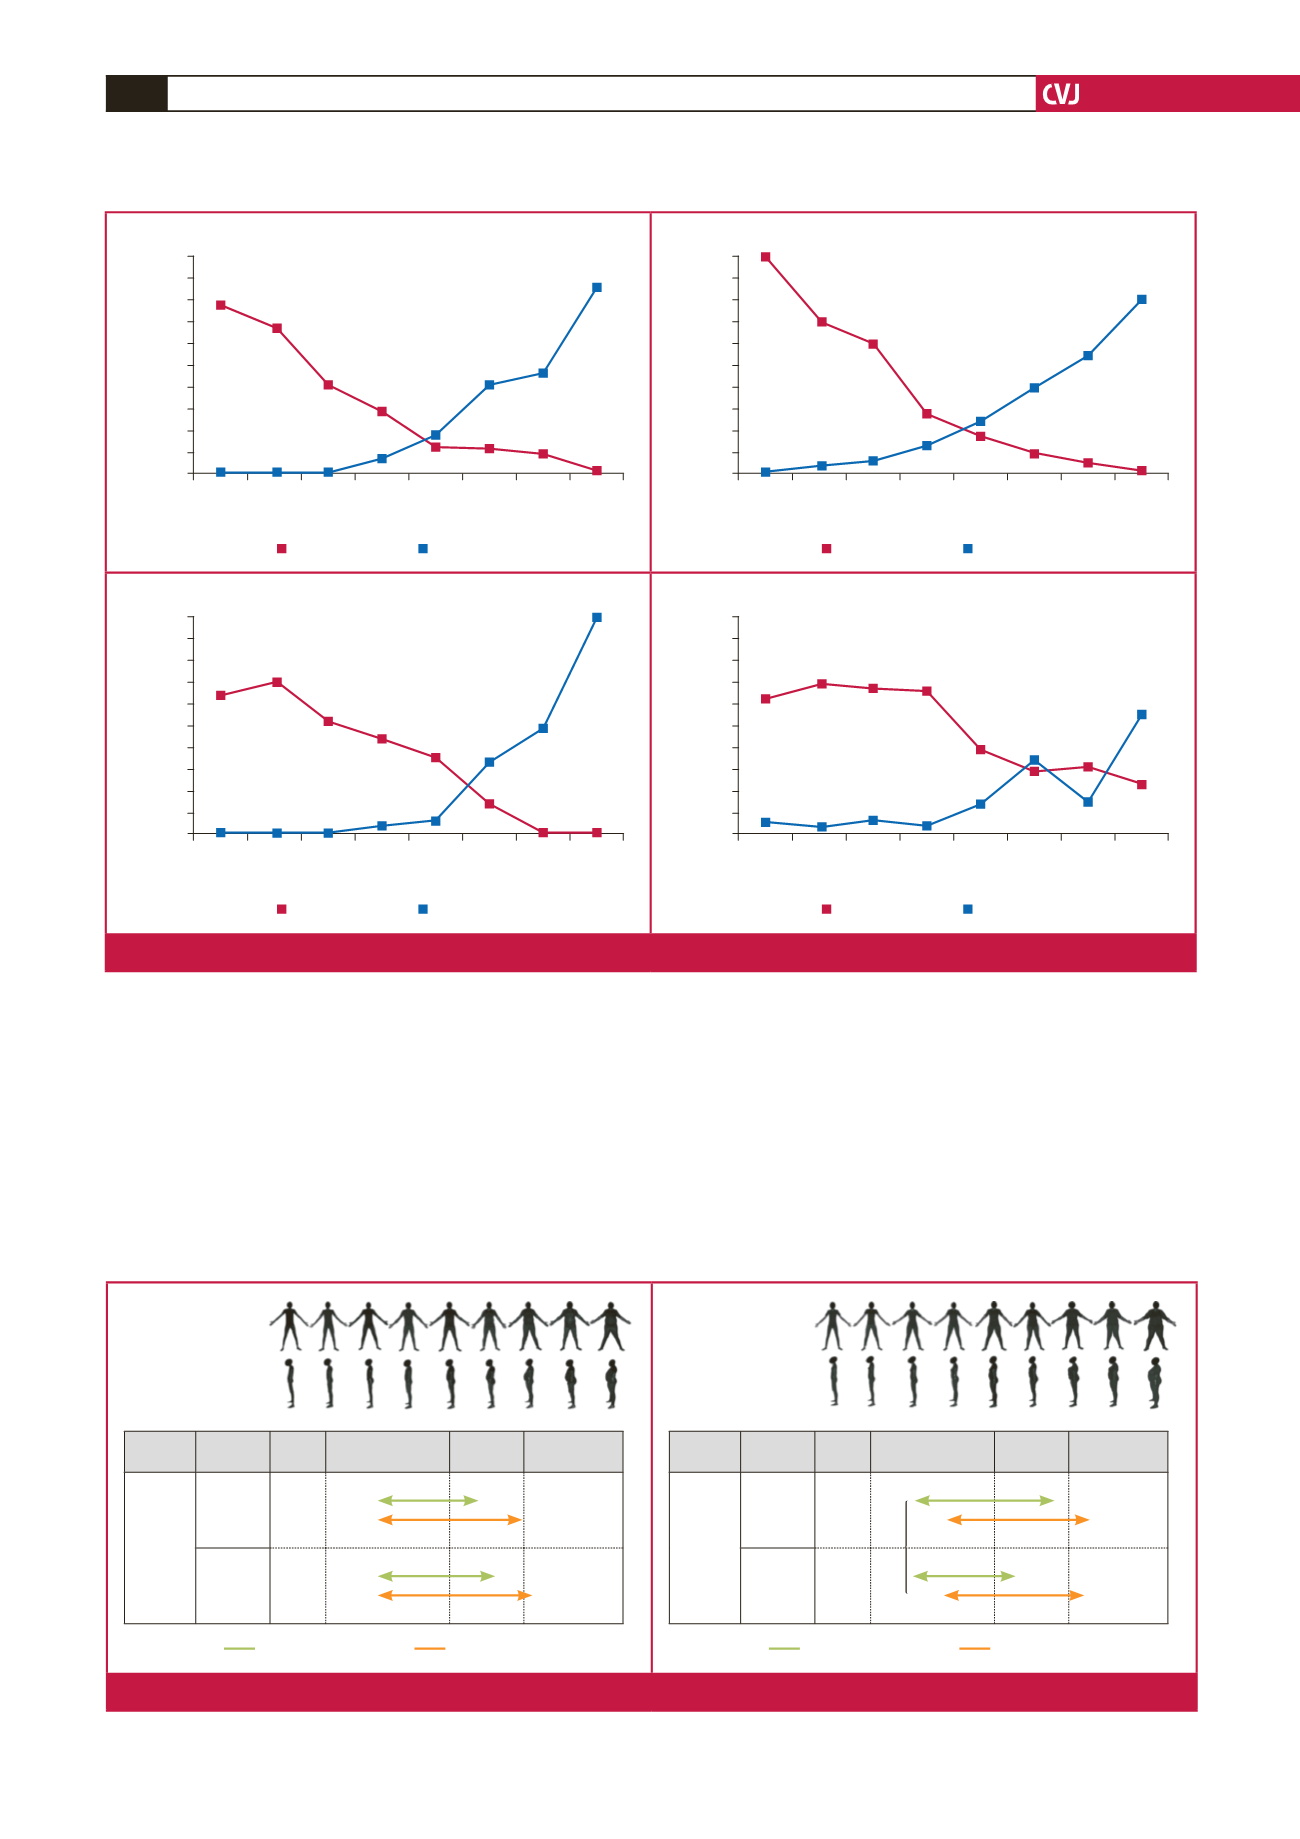
Scientific
Norms Averages Under-
weight
Normal weight
Over-
weight
Obesity
levels
Ideal
body
size
Men
4.5 ± 1.3
5.1 ± 1.7
***
Women
4.6 ± 1.4
5.1 ± 1.8
***
1 2 3 4 5 6 7
9 8
Urban Senegalese
Rural Senegalese
Scientific
Norms Averages Under-
weight
Normal weight
Over-
weight
Obesity
levels
Ideal
body
size
Women
4.7 ± 1.7
5.5 ± 1.8
***
Men
4.2 ± 1.4
5.3 ± 1.7
***
1 2 3 4 5 6 7
9 8
Urban Senegalese
Rural Senegalese
***
Fig. 3.
Perceptions of ideal body size on masculine and feminine body size scale.