


 28 / 64

CARDIOVASCULAR JOURNAL OF AFRICA • Volume 31, No 5, September/October 2020
248
AFRICA
proportion of study subjects had a history of percutaneous
coronary intervention (33.2%) and/or coronary artery bypass
grafting (21.0%). The most frequent cardiovascular risk factors
were hypertension (77.6%) and diabetes mellitus (64.4%). The
prevalence of diagnosed FH in this cohort was 20.6%.
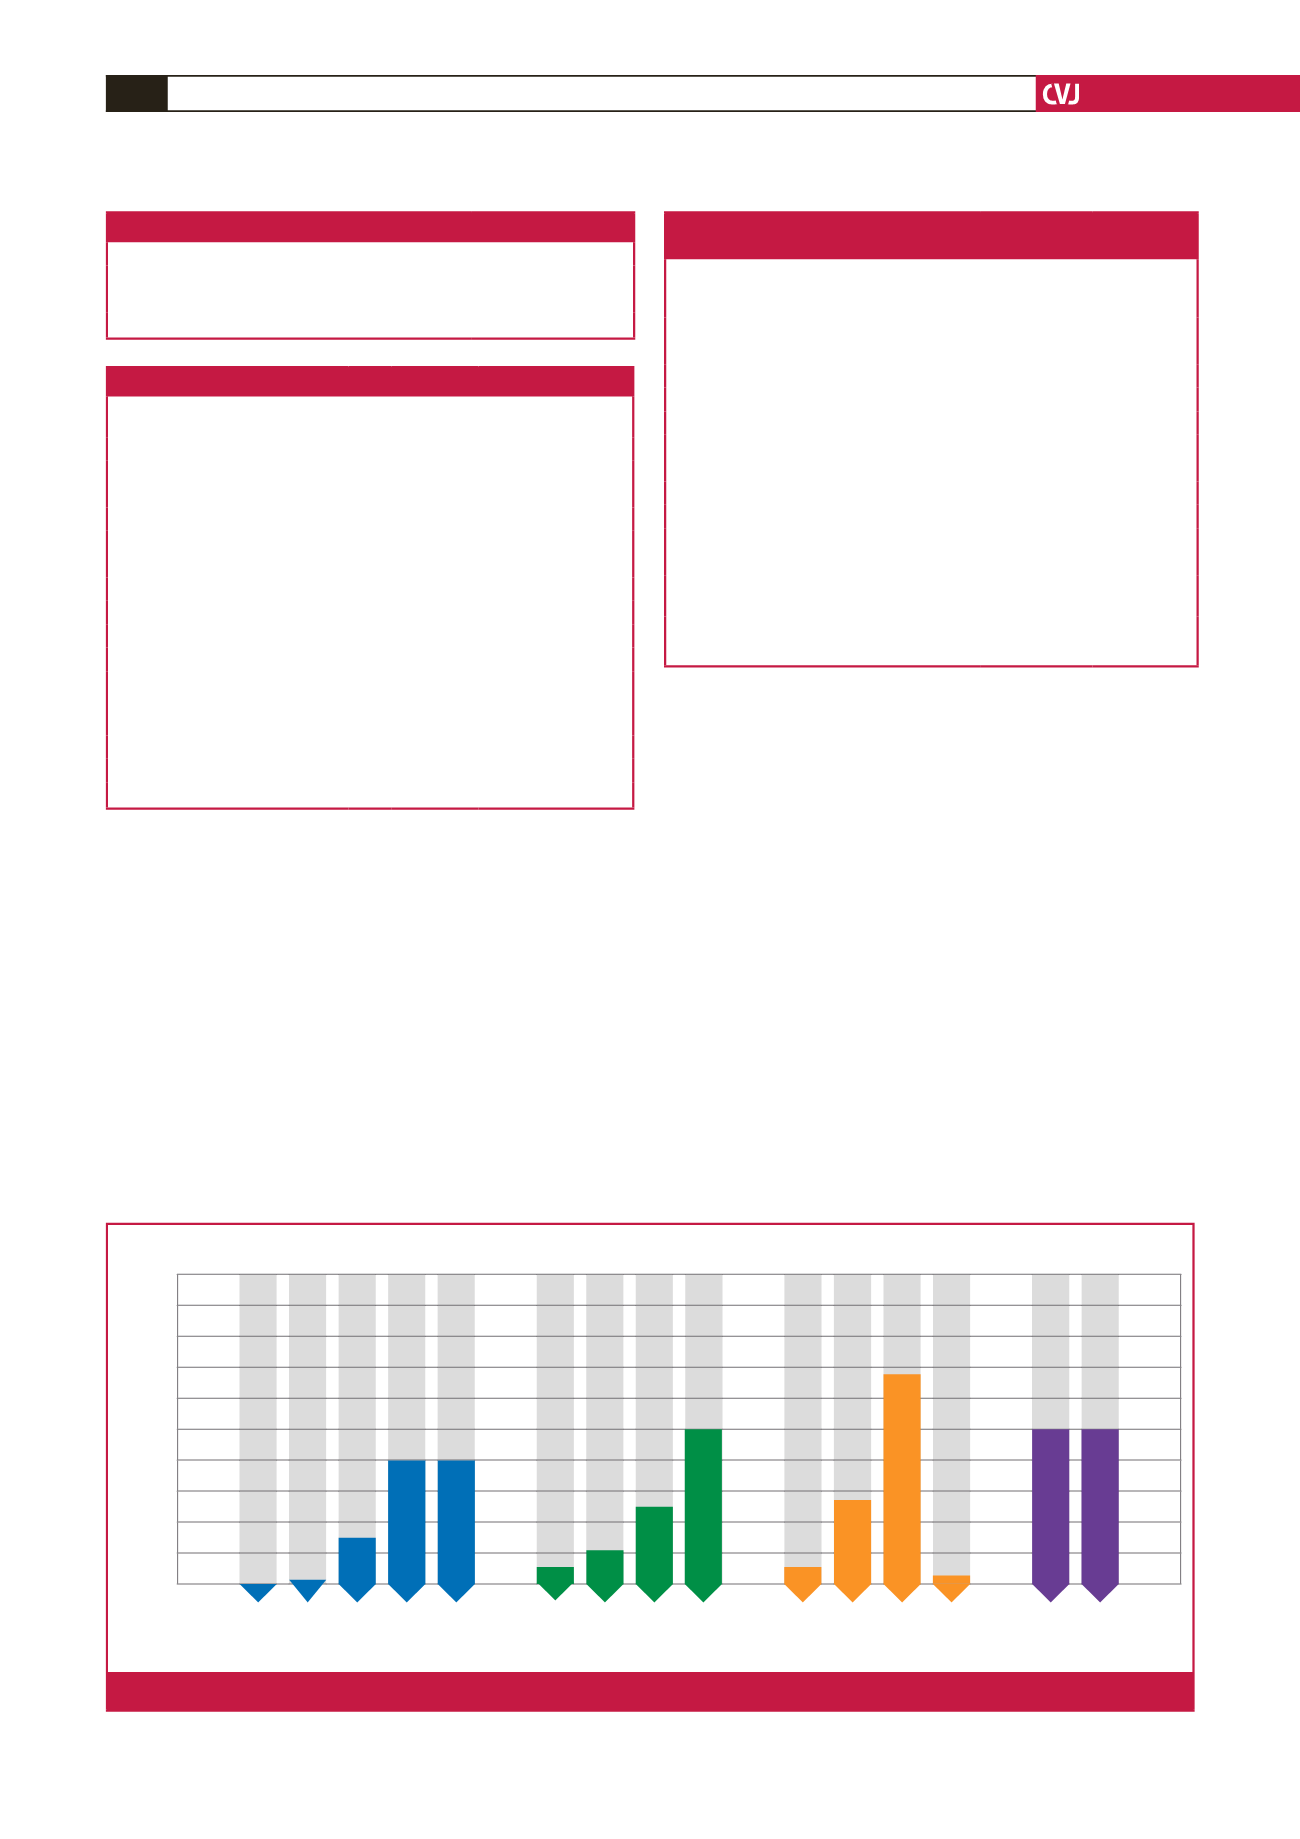
Most patients (50.0%) were taking atorvastatin, followed
by rosuvastatin (30.8%), simvastatin (18.8%) and pravastatin
(0.4%). All were on the maximum-tolerated dose of statin
therapy according to their physician’s assessment. The number
of patients on different statins is shown in Fig. 1.
Only 68 (13.8%) of the patients were prescribed ezetimibe and
none received ezetimibe monotherapy (Table 5). The reported
reasons for not using ezetimibe included that ezetimibe use was
not considered necessary by the prescribing physician (48.7%),
financial constraints relating to cost or reimbursement (31.7%),
physician choice (8.3%) and other (11.3%). Most patients
prescribed ezetimibe were also receiving high-intensity statin
therapy (atorvastatin 40–80 mg or rosuvastatin 20–40 mg) and
were defined as the maximum-treatment group.
Only 161 of the 491 (32.8%) patients who were taking the
maximum-tolerated statin dose, with or without ezetimibe,
reached the LDL-C goal of
<
1.8 mmol/l. This percentage was
even lower (16.2%) in patients on ezetimibe. In the group of
maximally treated patients (high-dose statin plus ezetimibe) the
at-goal rate was 13.2%.
In the 330 patients not at LDL-C goal, the LDL-C level was
between 2.5 and 5.0 mmol/l in most patients (56.4%). Less than
20% (18.8%) of these patients were receiving maximal lipid-
lowering therapy. LDL-C level higher than 5 mmol/l despite
aggressive therapy was relatively uncommon and was found in
only 16 (4.8%) patients. More females than males (nine vs seven)
had an LDL-C level of
>
5 mmol/l on treatment, although our
study overall had recruited significantly more males than females.
100
90
80
70
60
50
40
30
20
10
0
Percentage
5 mg 10 mg 20 mg 40 mg 80 mg
Atorvastatin
5 mg 10 mg 30 mg 40 mg
Rosuvastatin
10 mg 20 mg 40 mg 80 mg
Simvastatin
10 mg 80 mg
Pravastatin
Patients,
n
= 468*
n
= 1
n
= 2
n
= 36
n
= 98
n
= 97
n
= 7
n
= 15
n
= 51
n
= 71
n
= 3
n
= 23
n
= 61
n
= 1
n
= 1
n
= 1
Fig. 1.
Statin doses (
n
=
468
*
).
Table 5. Ezetimibe use in the study population
Combination of ezetimibe and statin
(
n
=
68)
mg
Number (%)
Atorvastatin (
n
=
32)
10
2 (2.9)
20
1 (1.5)
40
2 (2.9)
80
27 (39.7)
Rosuvastatin (
n
=
25)
10
1 (1.5)
20
4 (5.9)
40
20 (29.4)
Simvastatin (
n
=
10)
20
5 (7.3)
40
5 (7.3)
Pravastatin (
n
=
1)
10
1 (1.5)
Maximum treatment group (
n
=
53) mg
Number
(%)
Reached LDL-C goal,
n
(%)
Ezetimibe + atorvastatin
40
2 (3.8)
1 (50.0)
80
27 (50.9)
2 (7.4)
Ezetimibe + rosuvastatin
20
4 (7.5)
1 (25.0)
40
20 (37.7)
4 (20.0)
Table 6. Patient characteristics stratified by
LDL-C
<
1.8 mmol/l (goal) and
>
5 mmol/l
Patient characteristics
LDL-C goal
(
<
1.8 mmol/l)
(
n
=
161)
LDL-C
>
5 mmol/l
(
n
=
16)
Gender,
n
(%)
Male
118 (73.2)
7 (43.7)
Female
43 (26.7)
9 (56.3)
Age mean (years), mean
±
SD
62.9
±
10.5
53.9
±
10.9
Ethnicity,
n
(%)
Black
34 (100.00)
0 (0.0)
Caucasian
48 (87.3)
7 (12.7)
Asian
72 (97.3)
2 (2.7)
Mixed
7 (50.0)
7 (50.0)
Duration of dyslipidaemia (years), mean
±
SD 10.9
±
7.4
14.3
±
11.6
Obesity (BMI
>
30 kg/m
2
),
n
(%)
72 (45.3)
6 (37.5)
Family history of premature atherosclerotic
disease,
n
(%)
33 (20.5)
6 (37.5)
Familial hypercholesterolaemia,
n
(%)
4 (2.5)
13 (81.3)
Diabetes mellitus,
n
(%)
121 (75.2)
6 (37.5)
Table 4. Family history of premature cardiovascular events (
n
=
491)
Family history
Number (%)
Coronary artery disease
133 (27.1)
Cerebrovascular disease
36 (7.3)
Peripheral artery disease
3 (0.6)