


 34 / 64

CARDIOVASCULAR JOURNAL OF AFRICA • Volume 31, No 5, September/October 2020
254
AFRICA
Discussion
Over a median follow up of 8.5 months, the invasive strategy
significantly reduced total mortality rates compared to the
conservative strategy in ACS patients who were older than 80
years. Other than the conservative strategy, older age, presence
of hypertension, low ejection fraction below 40%, high GRACE
risk score and presentation with STEMI were also found to be
related to long-term mortality rate.
Age is an important risk factor for ACS, and advanced age
is also strongly associated with mortality in the presence of
ACS.
14
The GRACE investigators showed that, among patients
presenting with NSTEMI and referred for PCI or CABG,
six-month mortality rate increased with age (1.6, 4.3 and 7.0%
in patients
<
70 years, 70–80 years and
>
80 years, respectively).
15
In 47 407 consecutive patients who underwent PCI and were
prospectively enrolled in the PCI registry of the EHS programme,
in-hospital mortality rate was 1.7% in ACS patients less than 75
Table 1. Patients’ clinical characteristics by adopted strategy
Clinical characteristics
Total
(
n
=
156)
Invasive
strategy
94 (60.3%)
Conservative
strategy
62 (39.7%)
p
-value
Demographic chracteristics
Age (median,IR)
156 83.0 (4)
85.0 (6)
0.002
Men,
n
(%)
80 50 (53.2)
30 (48.4)
0.557
Risk factors,
n
(%)
Smoking
68 44 (46.8)
24 (38.7)
0.318
Dyslipidaemia
36 22 (23.4)
14 (22.6)
0.905
Hypertension
99 52 (55.3)
47 (75.8)
0.015
Diabetes
61 37 (39.4)
24 (38.7)
0.935
Biochemical risk profile (median, IR)
CKMB (ng/ml)
156 15.8 (73.9)
9.0 (25.2)
0.275
Troponin I (ng/ml)
156 0.5 (2.4)
0.2 (1.6)
0.213
Total cholesterol (mg/dl)
156 164.0 (62.0) 166.5 (64.0) 0.841
(mmol/l)
4.25 (1.61)
4.31 (1.66)
HDL cholesterol (mg/dl)
156 41.0 (15.0)
43.0 (19.0) 0.859
(mmol/l)
1.06 (0.39)
1.11 (0.49)
Triglycerides (mg/dl)
156 99.0 (54.0) 107.5 (105.0) 0.488
(mmol/l)
1.12 (0.61)
1.21 (1.19)
Serum creatinine (mg/dl)
156 0.9 (0.4)
1.1 (0.6)
0.042
Admission haemoglobine (g/dl)
156 12.3 (2.5)
12.1 (2.4)
0.518
Serum glucose (mg/dl)
156 123.0 (63.0) 121.0 (57.0) 0.815
(mmol/l)
6.83 (3.5)
6.72 (3.16)
Clinical risk profile
SBP (mmHg) (median, IR)
156 128.0 (32.5) 128.0 (36.5) 0.882
Heart rate (bpm) (median, IR)
156 80.0 (20.0)
80.0 (25.0) 0.087
GRACE risk score classes,
n
(%)
≤
150
43 30 (31.9)
13 (21.0)
0.320
151–174
75 42 (44.7)
33 (53.2)
≥
175
38 22 (23.4)
16 (25.8)
Cardiac arrest at admission,
n
(%)
4 2 (2.1)
2 (3.2)
0.671
Ejection fraction classes,
n
(%)
≤
40%
61 33 (35.1)
28 (45.2)
0.208
>
40%
95 61 (64.9)
34 (54.8)
Presentation symptoms,
n
(%)
Chest pain
127 84 (89.4)
43 (69.4)
0.002
Dyspnoea
29 10 (10.6)
19 (30.6)
ECG results,
n
(%)
Sinus rhythm
131 76 (80.9)
55 (88.7)
0.390
Atrial fibrillation
20 14 (14.9)
6 (9.7)
Atrioventriculer block
5 4 (4.3)
1 (1.6)
IR, interquartile range; CKMB, creatine kinase myocardial band; HDL, high-
density lipoprotein; SBP, systolic blood pressure; ECG, electrocardiography.
Table 2. Patients’ outcome according to
invasive or conservative strategy
Outcome
Invasive
94 (60.3%)
Conservative
62 (39.7%)
p-
value
Mortality,
n
(%)
30-day cumulative
0 (0)
11 (17.7)
<
0.001
T1 time point
13 (13.8)
8 (15.7)
0.762
T2 time point
16 (17.0)
13 (25.5)
0.223
12-month cumulative
16 (17.0)
24 (38.7)
0.004
Total
24 (25.5)
30 (48.4)
0.006
T1, 31 days to 6 months; T2, 31 days to 12 months.
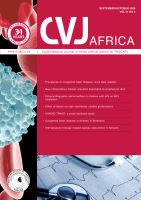
Event rate %
14
12
10
8
6
4
2
0
0.00
2.00
4.00
6.00
8.00
10.00
Time from admission (months)
OR 0.37
95% CI: 0.15–0.95,
p
=
0.040
Treatment strategy
Invasive
Conservative
Fig. 1.
One-year mortality rates based on treatment strategy.
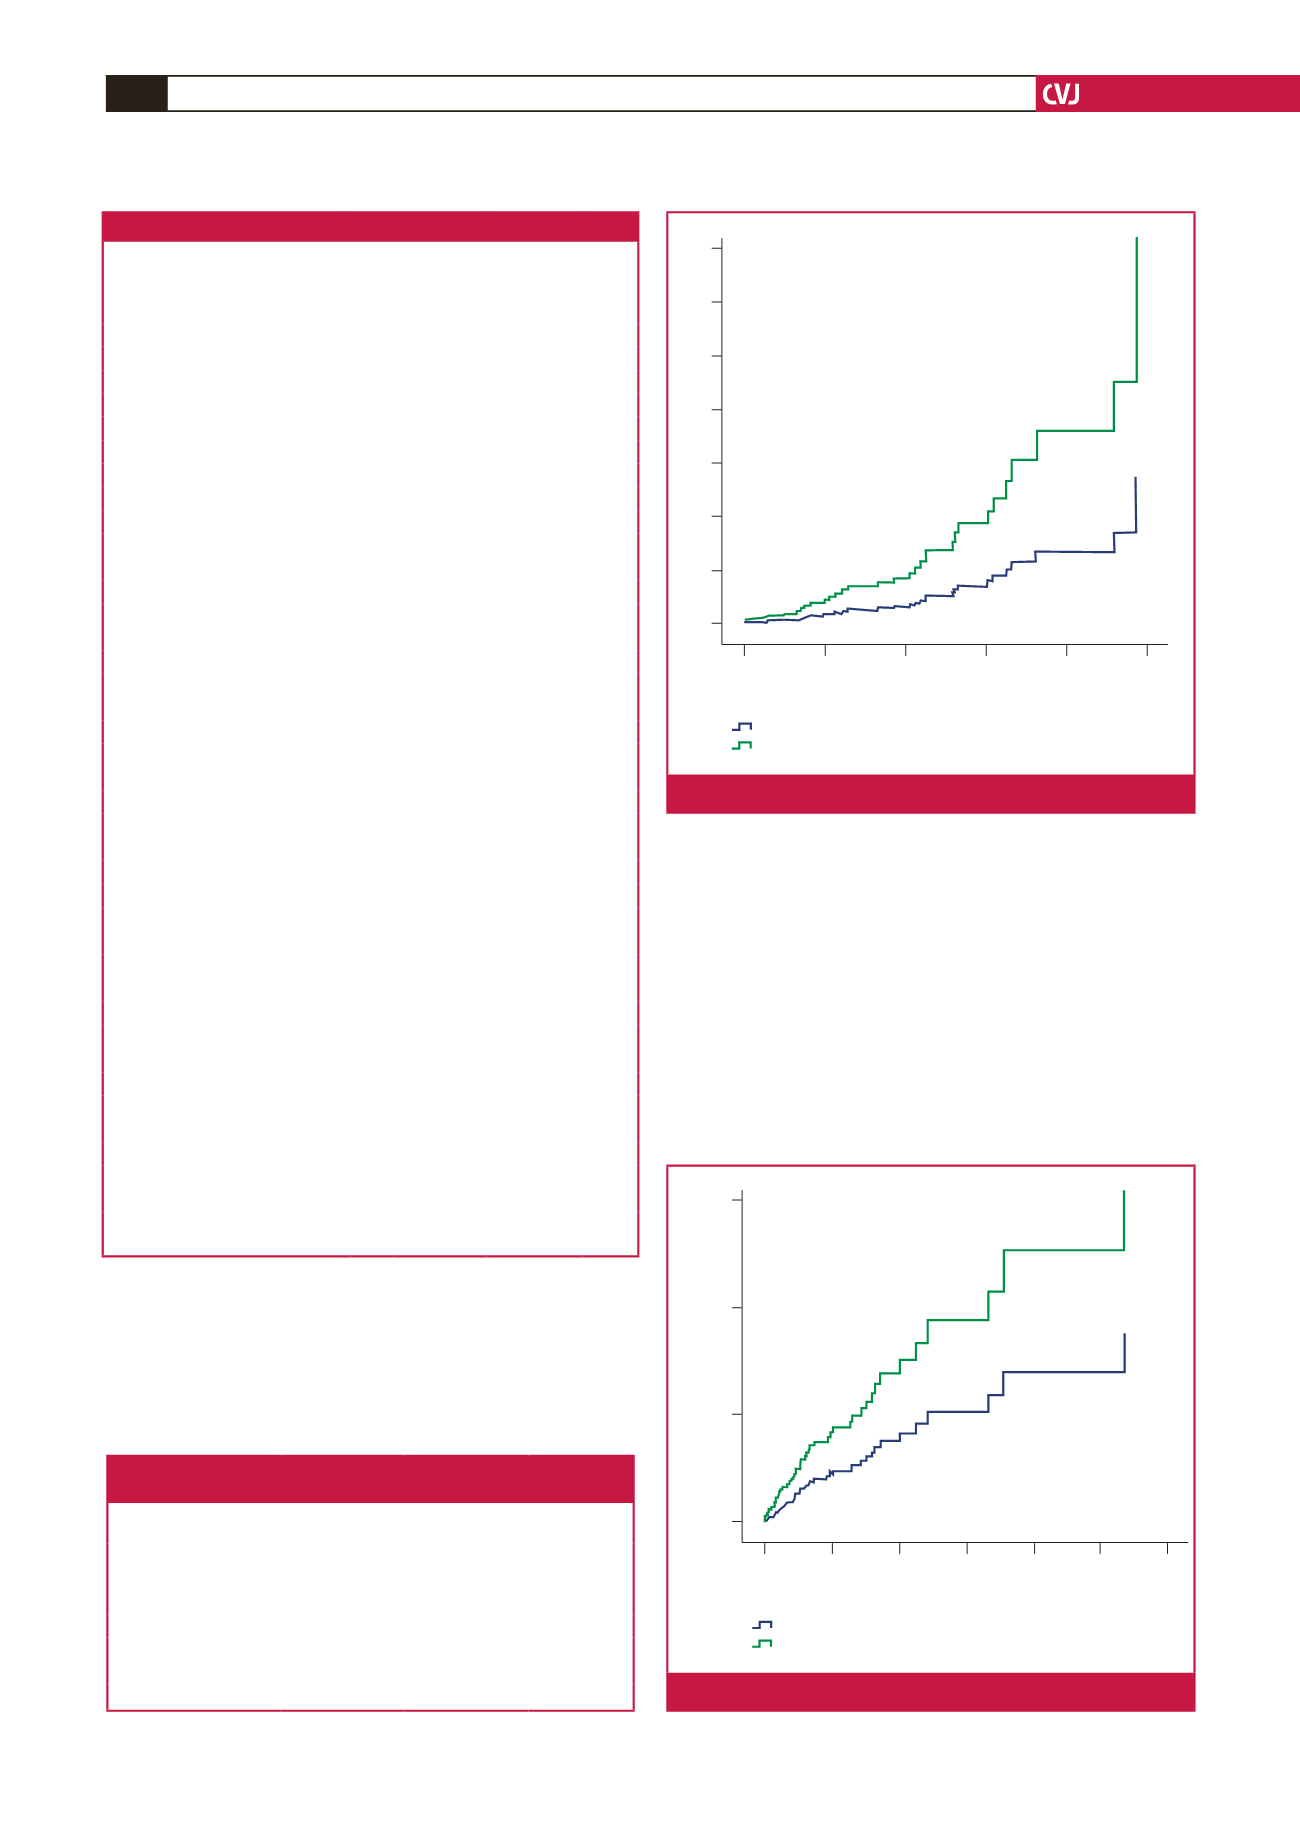
6
4
2
0
0.00 10.00 20.00 30.00 40.00 50.00 60.00
Time from admission (months)
OR 0.26
95% CI: 0.12–0.56,
p
=
0.001
Treatment strategy
Invasive
Conservative
Event rate %
Fig. 2.
Five-year mortality rates based on treatment strategy.