
CARDIOVASCULAR JOURNAL OF AFRICA • Volume 31, No 6, November/December 2020
306
AFRICA
statistical power principles, this individual was excluded from the
statistical analyses.
High-resolution ultrasound CIMT scans were used to
determine structural changes or subclinical atherosclerosis.
CIMT images from two ideal angles of the left and right
common carotid artery segments were captured using a
SonoSite Micromaxx ultrasound system (SonoSite Inc, Bothell,
WA, USA) and a 6–13-MHz linear display transducer, using
previously described protocols.
14
Images were digitised and
imported to Artery Measurement Systems automated software
(AMS, Gothenburg, Sweden, v1.130) for analysing CIMT.
40,41
A maximal 10-cm segment with good-quality imaging was used
for analysis. The program automatically detects the borders of
the intima–media of the near and far wall, as well as the inner
diameter of the vessel, and calculates CIMT. For this study, the
far wall left CIMT measurements were used.
Intra-observer variability was 0.04 mm between two
measurements taken four weeks apart on the same 10 participants.
CIMT of > 0.9 mm was regarded as subclinical atherosclerosis.
42
The images were also examined for the presence of plaque at the
right and left bifurcation of the internal carotid artery. Plaque
was defined as a focal structure encroaching into the arterial
lumen by at least 0.5 mm or by 50% of the surrounding intima–
media thickness or demonstrating a thickness > 1.5 mm.
14
A registered nurse obtained fasting resting blood samples
with a winged infusion set from the brachial vein branches of
the dominant arm, handled according to standardised methods
and stored at –80°C until analysis. Serum high-sensitivity
CRP was analysed with a timed, end-point method (UniCel
®
DxC 800, Beckman and Coulter, Germany). Inter- and intra-
variability was less than 5%. CRP ≥ 3 mg/l is regarded as
low-grade inflammation as well as a high risk for CVD.
43
Serum
cholesterol blood sample analysis was done using the Konelab™
20i (Thermo Scientific, Vantaa, Finland).
Statistical analysis
Statistical analysis was performed on the data from the 215
participants using SPSS v25 (Inc, Chicago, IL, USA). Normality
was assessed using normal QQ plots for visual inspection
and the statistical Shapiro–Wilk normality test. Independent
t
-test and ANOVA were used to determine gender and group
differences. Additionally, the chi-squared test was used to
compare proportions. Analyses for the entire group and specific
age groups were also done in the BMI categories. The age
groups were determined according to the guidelines suggested
by ‘Statistics: provisional guidelines on standard international
age classification of 1982’,
44
with age 25–44 years representing
young adulthood, and 45–64 years representing adulthood
(further referred to as middle adulthood). Analyses were done
according to the two PA categories of sedentary (≤ 1.5 METs)
and light-intensity PA (1.5–3 METs) for CIMT, BP, CRP and
anthropometric variables.
Pearson correlation coefficient [rho (
r
)] was used to assess
the relationship between CIMT and objectively measured PA.
Partial correlations followed to determine: (1) the relationship
between CIMT, mean seven-day awake METs, AEE, TEE and
PAL for both the sedentary and light-PA groups, considering
the confounders age, gender, BMI and WC; and (2) associations
between CIMT, mean seven-day awake METs, AEE, TEE and
PAL for sedentary and light-PA groups in separate male and
female groups, controlling for age group, serum cholesterol
level, ambulatory 24-hour BP, CRP and WC. The statistical
significance was set at
p
≤ 0.05.
Results
The participants were classified according to age groups,
consisting of young adulthood (25–44 years) and middle
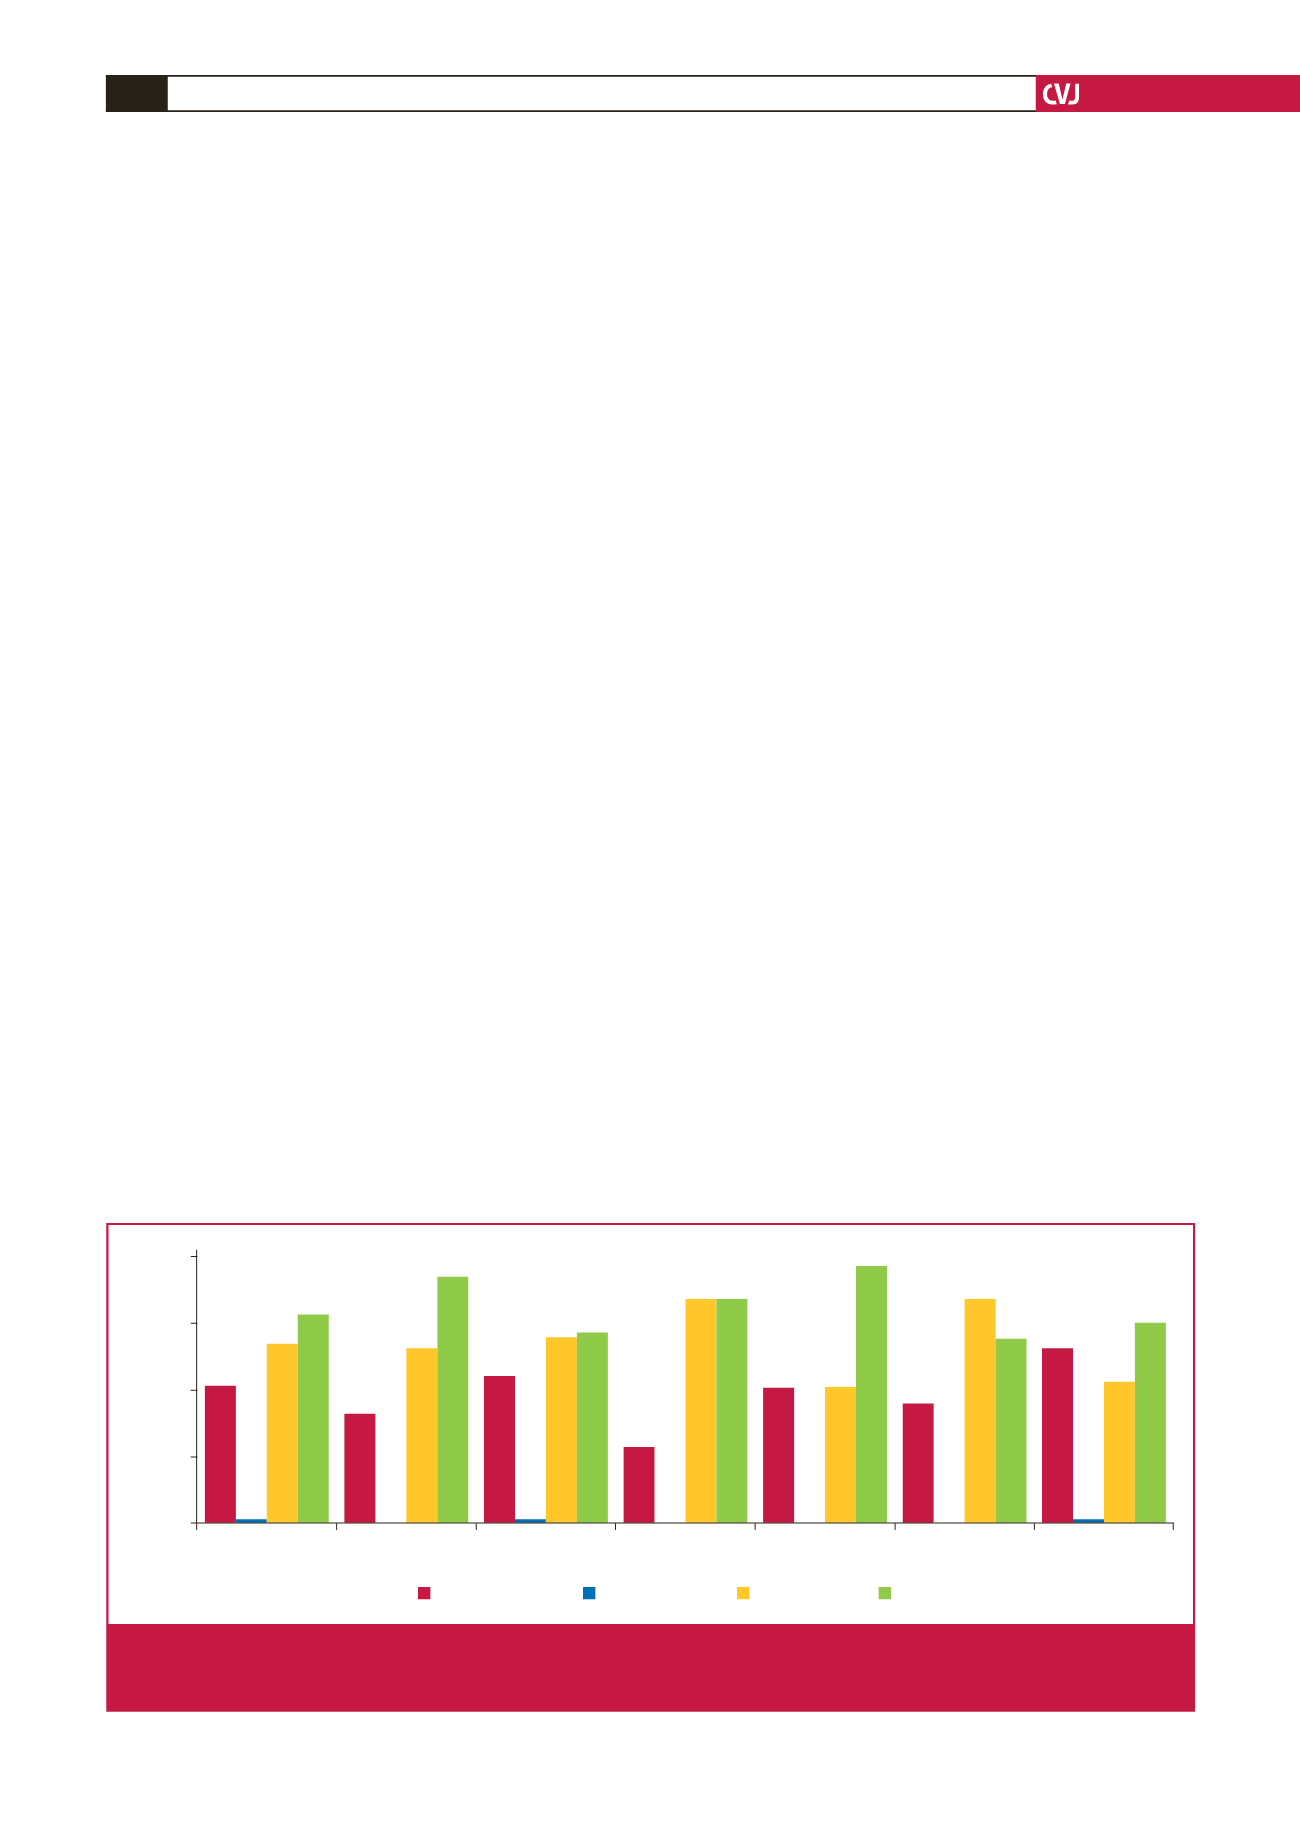
adulthood (45–64 years). Fig. 1 indicates that the prevalence of
overweight (34%) and obesity (39%) was high among the entire
group of teachers, especially obesity in the young-adult group
(46%). Almost half of the young-adult female teachers (48%)
were obese.
PA classification according to the mean seven-day awake
METs showed that 67 and 33% of the total participants
were respectively classified as in the sedentary and light-PA
categories (Fig. 2). Fig. 3 shows that 39% of the participants
26
34
39
21
33
46
28
35 36
15
42 42
26
26
48
23
42
35 33
27
38
1
0
0
0
1
0
1
Total
participants
Young
adulthood
Middle
adulthood
Male: young
adulthood
Female: young
adulthood
Male: middle
adulthood
Female: middle
adulthood
Percentage (%)
50
38
25
13
0
Normal weight
Underweight
Overweight
Obesity
Fig. 1.
Percentage of total participants according to BMI categories, age group and gender/age group combined.Young adulthood
=
25–44 years, middle adulthood
=
45–64 years; normal weight
=
18.5–24.9 kg/m
2
, underweight
= ≤
18.5 kg/m
2
, overweight
=
25–29.9
kg/m
2
, obesity
=
≥
30 kg/m
2
.


