


 27 / 64

CARDIOVASCULAR JOURNAL OF AFRICA • Volume 31, No 6, November/December 2020
AFRICA
307
that were grouped in the sedentary classification were obese and
31% were overweight. Therefore, more than two-thirds of the
sedentary participants were overweight or obese. In the light-PA
classification, 36% of the participants were overweight and 39%
were obese.
In the analysis of CIMT in the two age groups (Table 1), a
significantly higher CIMT was found for the middle-adulthood
group compared with the young-adult group (0.73 ± 0.14 vs 0.64
± 0.16 mm;
p
< 0.001). For the total group, male teachers had
a significantly higher mean CIMT compared to female teachers
(
t
= 4.971; df = 193.82;
p
< 0.05). When male and female teachers
were divided into young- and middle-adulthood groups, the
middle-adulthood group showed a significantly higher mean
CIMT (
t
= –3.614; df = 87.309;
p
= 0.001). Similarly, the young-
and middle-adulthood male teachers presented with significantly
higher mean CIMT (
t
= 3.330; df = 40.33;
p
= 0.002) compared
with the young- and middle-adulthood females (
t
= 3.702; df
=
143.21;
p
< 0.05).
In the analysis of CIMT according to gender in the two age
groups (Table 1), a significantly higher CIMT (
t
= 4.616; df
=
54.81;
p
< 0.001) was found in the middle-adulthood female
teachers (0.69 ± 0.11 mm) compared with the young-adult
female teachers (0.58 ± 0.11 mm).
Out of 216 participants (Table 2), 38.9% were hypertensive,
with middle-aged adults being more affected (39.6%) compared
Table 1. Differences in CIMT between young and middle adulthood,
and male and female teachers
Group (
n
=
215)
n
CIMT (mm)
Mean
±
SD
t
-test
df
p
-value
Male
104 0.74
±
0.16 4.930 193.82
<
0.001
*
Female
111 0.66
±
0.12
Young adult (total group)
57 0.64
±
0.16 –3.614 87.309 0.001
*
Middle adult (total group) 158 0.73
±
0.14
Young adult males
26 0.71
±
0.18 3.330 40.33 0.002
*
Young adult females
31 0.58
±
0.11
Middle adult males
78 0.77
±
0.15 3.702 143.21
<
0.001
*
Middle adult females
80 0.69
±
0.11
Young adult females
31 0.58
±
0.11 –4.616 54.81
<
0.001
*
Middle adult females
80 0.69
±
011
Young adult males
26 0.71
±
0.18 –1.335 37.09 0.19
Middle adult males
78 0.77
±
0.15
Young adult
=
25–44 years; middle adult
=
45–64 years. CIMT
=
carotid intima–
media thickness; df
=
degree of freedom; SD
=
standard deviation;
t
-test of the
equality means. *Level of significance was set at
p
≤
0.05.
Table 2. Percentage scores and chi-squared
p
-values for hypertension and
CRP for the total group and according to PA and age group categories
Category
Hypertensive,
n (%)
Normotensive,
n (%)
Chi-
squared p-value
Total group (
n
=
216)
84 (38.9)
132 (61.1)
10.667 0.001
*
Young adults (
n
=
57)
21 (36.8)
36 (63.2)
3.947 0.05
*
Middle adults (
n
=
159)
63 (39.6)
96 (60.4)
6.849 0.01
*
Sedentary (
n
=
71)
38 (53.5)
33 (46.5)
0.352 0.55
Light PA (
n
=
145)
46 (31.7)
99 (68.3)
19.372
<
0.001
*
Sedentary males (
n
=
46)
30 (65.2)
16 (34.8)
4.261 0.04
*
Sedentary females (
n
=
25)
8 (32)
17 (68)
3.240 0.07
Light PA males (
n
=
58)
28 (48.3)
30 (51.7)
0.069 0.80
Light PA females (
n
=
87)
18 (20.7)
69 (79.3)
28.897
<
0.001
*
Increased
CRP No risk CRP
Chi-
squared p-value
Total group (
n
=
214)
88 (41.1)
126 (58.9)
6.748 0.01*
Young adults (
n
=
56)
30 (53.6)
26 (46.4)
0.286 0.59
Middle adults (
n
=
158)
58(36.7)
100 (63.3)
11.165 0.001
*
Sedentary (
n
=
71)
34 (47.9)
37 (52.1)
0.127 0.72
Light PA (
n
=
143)
54 (37.8)
89 (62.2)
8.566 0.003
*
Sedentary males (
n
=
46)
22 (48)
24 (52)
0.087 0.77
Sedentary females (
n
=
25)
12 (48)
13 (52)
0.040 0.84
Light PA males (
n
=
58)
14 (24)
44 (76)
15.517
<
0.001
*
Light PA females (
n
=
87)
40 (47.1)
45 (53)
0.294 0.59
Sedentary
= <
1.5METs; light PA
=
10.5–3 METs. Hypertension = 24-h systolic
blood pressure
≥
130 mmHg and/or diastolic blood pressure
≥
80 mmHg;
42
low-
grade inflammation = CRP
≥
3 mg/l.
43
*Level of significance was set at
p
≤
0.05
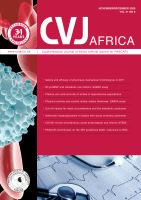
Total group
Time spent sedentary
Light intensity PA
33%
67%
Male
56% 44%
Time spent sedentary
Light intensity PA
Female
22%
78%
Time spent sedentary
Light intensity PA
Fig. 2.
Activity classification for the entire group and males and females according to mean seven-day awake METs. Time spent
sedentary
=
<
1.5 METs; light PA
=
1.5–3 METs.
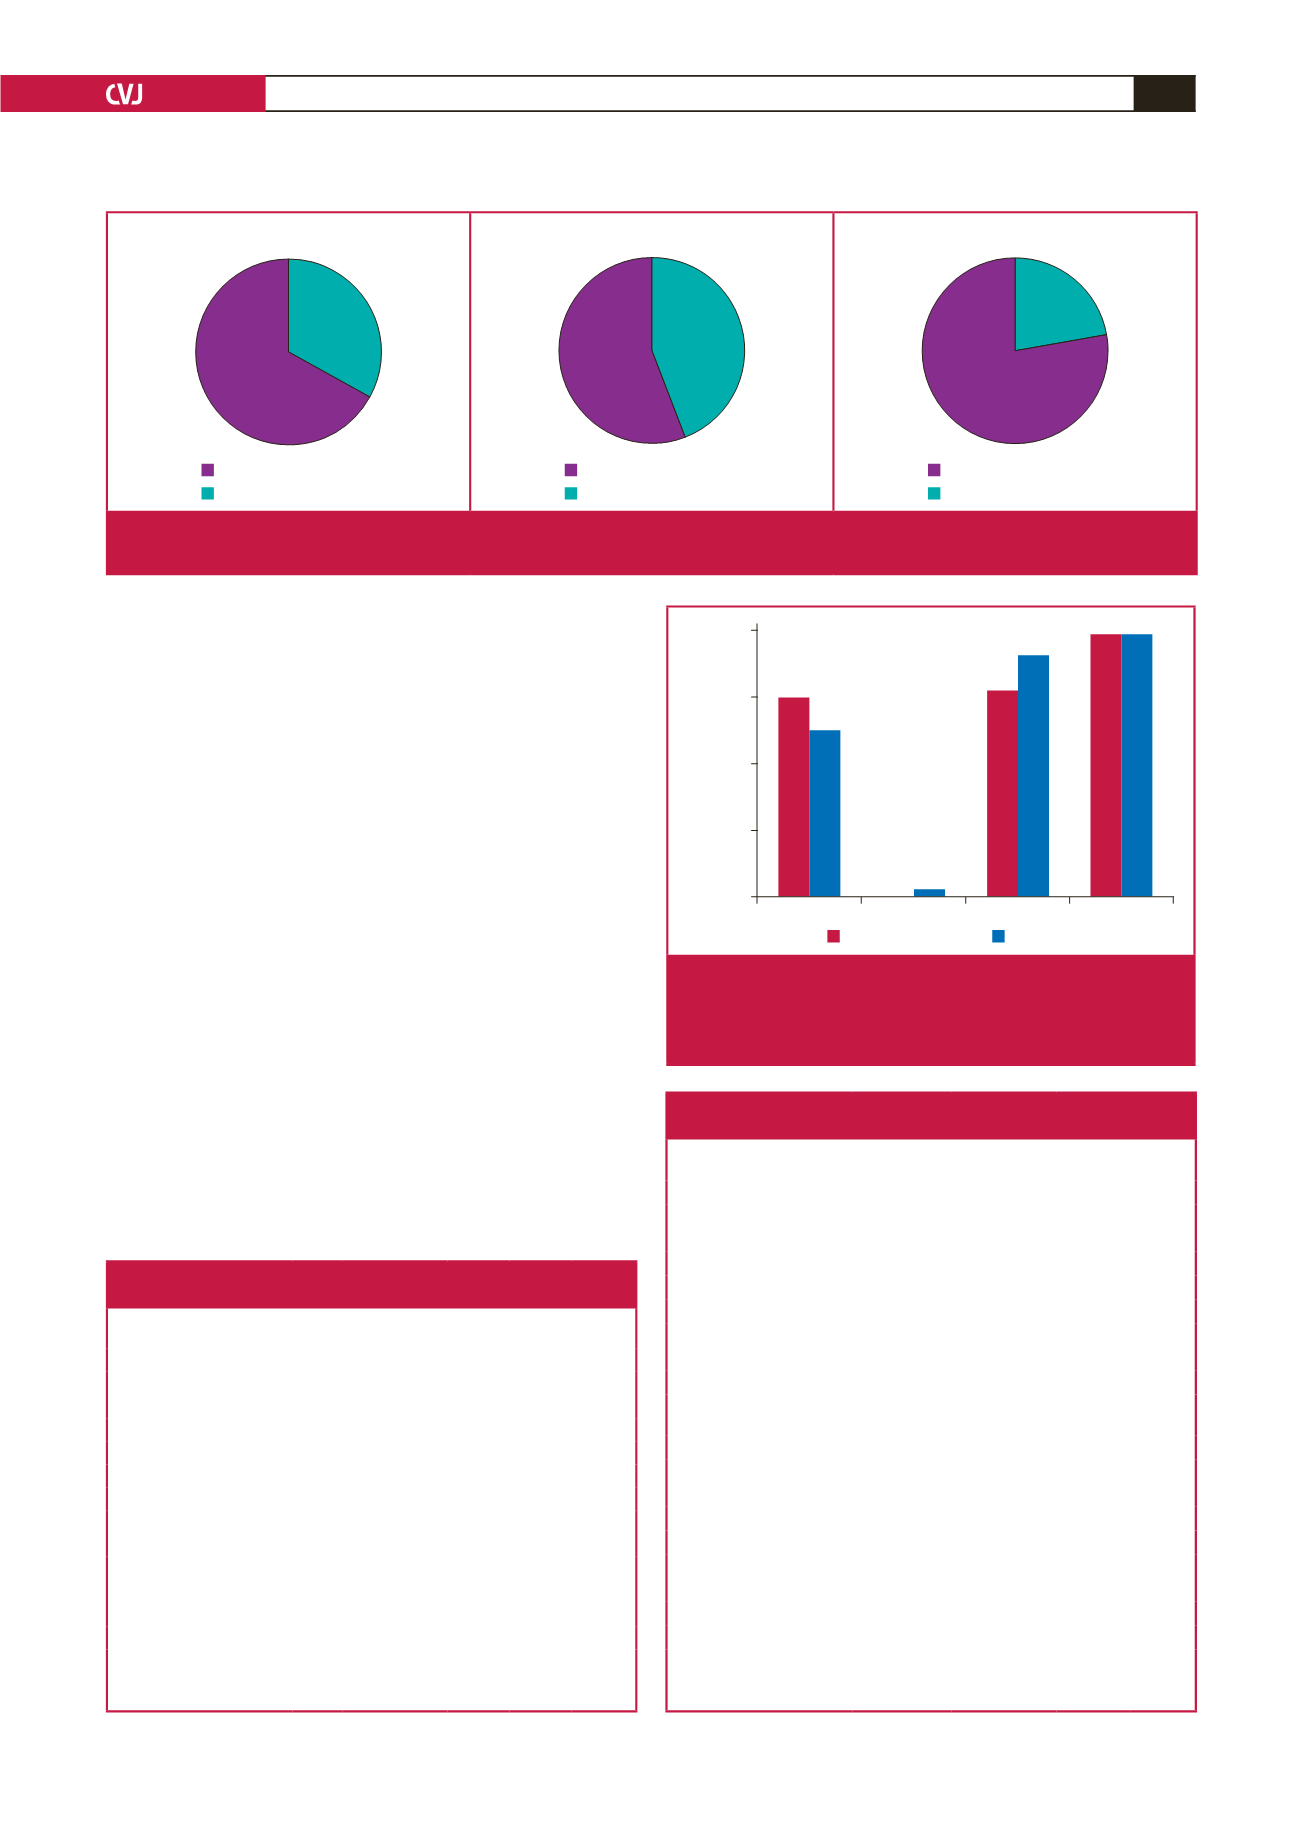
Normal weight Underweight Overweight
Obesity
Percentage (%)
40
30
20
10
0
Sedentary
Light activity
30
25
0 1
31
36
39 39
Fig. 3.
Percentage of participants in BMI categories according
to PA classification. Normal weight
=
18.5–24.9 kg/m
2
; under-
weight
=
≤
18.5 kg/m
2
; overweight
=
25–29.9 kg/m
2
; obesity
=
≥
30 kg/m
2
. Sedentary
=
≤
1.5 METs; light PA
=
1.5–3 METs.