


 36 / 64

CARDIOVASCULAR JOURNAL OF AFRICA • Volume 31, No 6, November/December 2020
316
AFRICA
BP, BG and TG. However, a significant gender difference
was observed for body mass index (BMI) (
p
< 0.001), hip
circumference (
p
< 0.001), waist–hip ratio (
p
< 0.001), systolic
BP (
p
< 0.001) and HDL-C (
p
< 0.001). The women presented
with a higher BMI (34.4 vs 13.0%) and WC (45.5 vs 11.0%) and
a lower HDL-C (50.0 vs 48.7%) compared to the men, who
presented with a higher systolic BP (50.3 vs 39.4%).
The overall prevalence of AO as determined by WC was
estimated at 47.9%, resulting in an estimated prevalence of the
MetS of 32.7% (IDF).
9
The prevalence of AO and the MetS was
found to be higher among women, at 69 vs 24.5% (
p
= 0.05), than
men, at 44.5 vs 20.0% (
p
= 0.001) (Table 1). Overall, low HDL-C
identified the highest candidates for the MetS (49.4%), followed
by WC (47.9%), TG (47.4%) and elevated BP (44.7%) (Table 1).
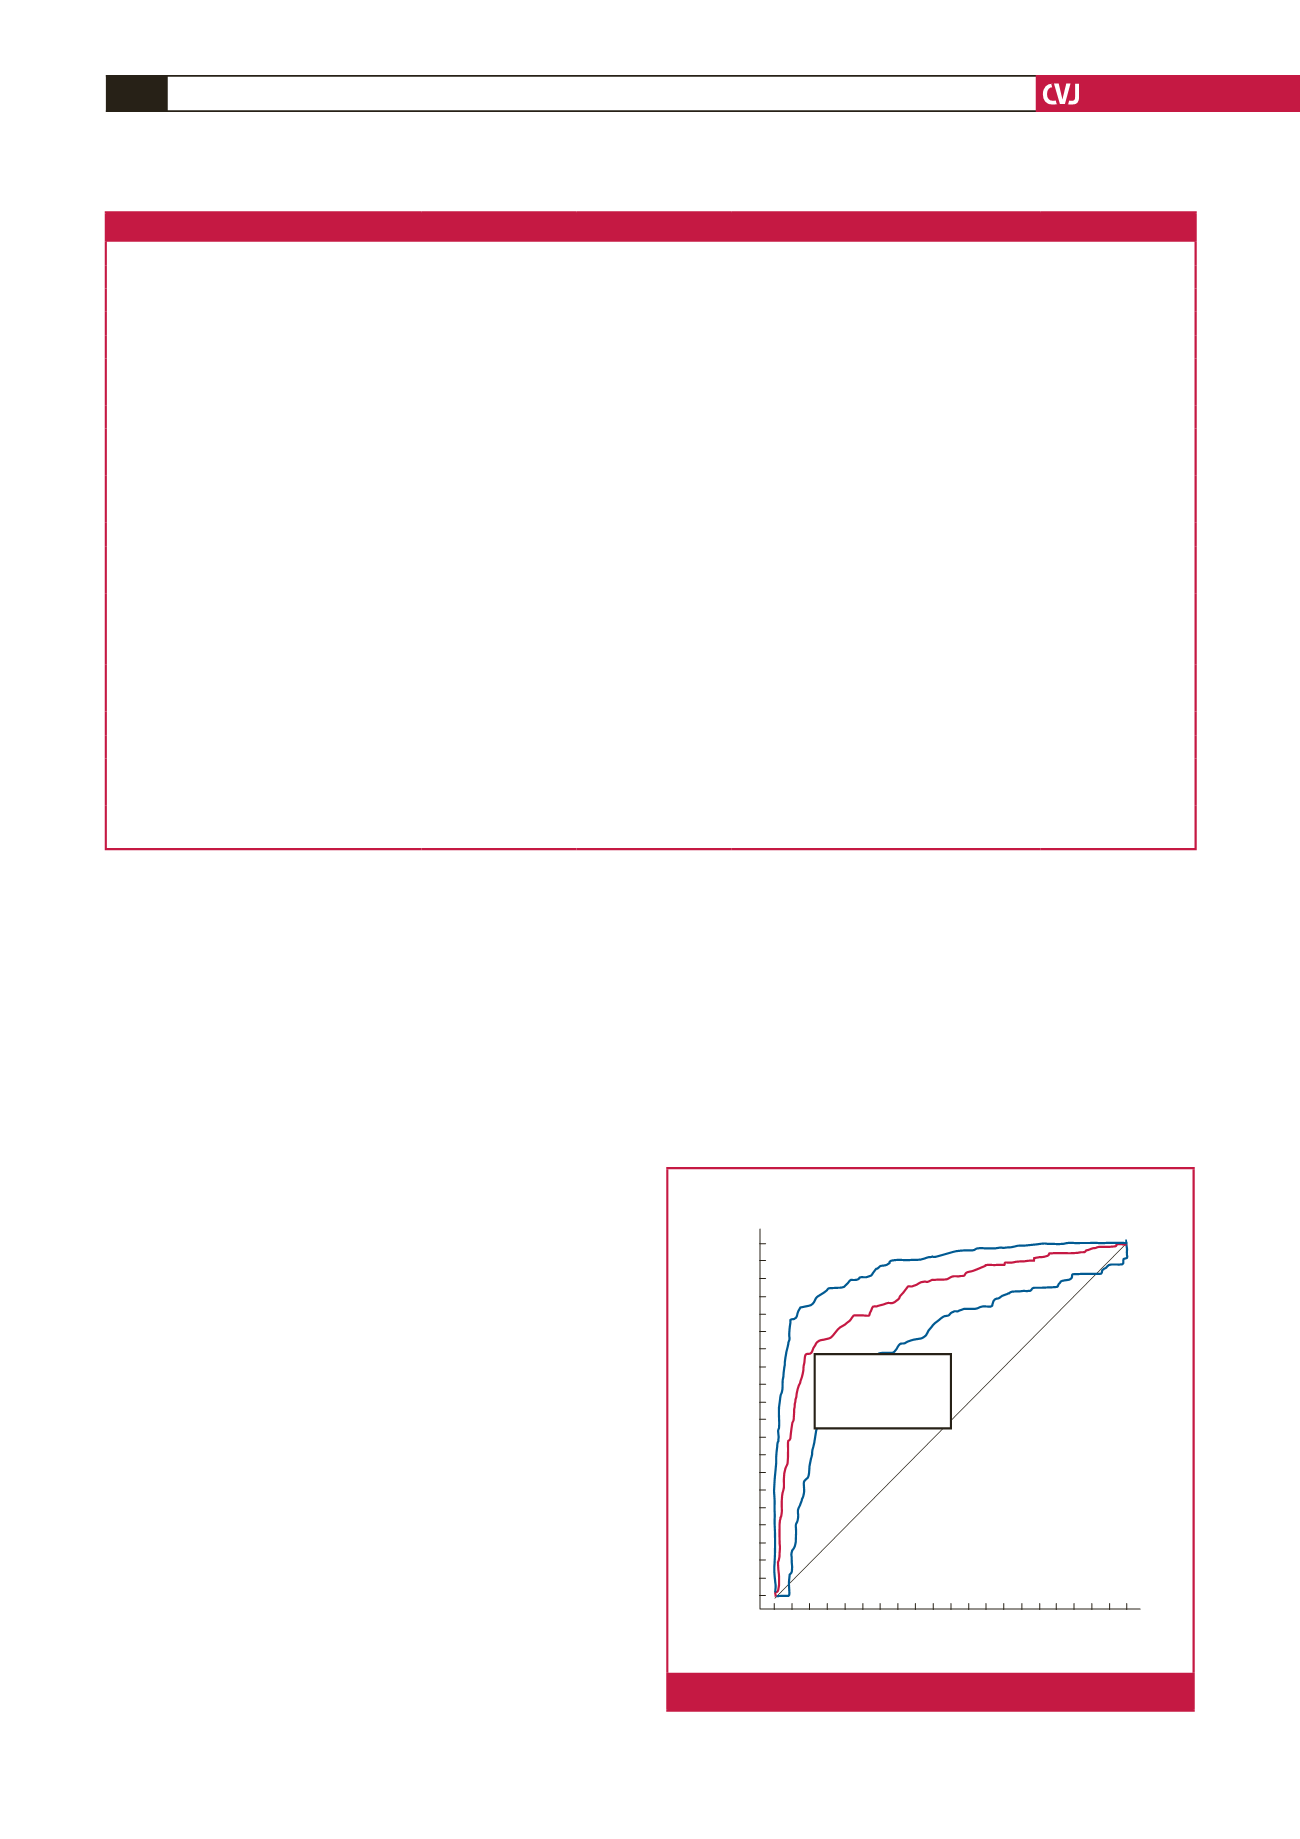
The ROC curve was used to determine the optimal cut-off
points for AO, predicting at least two other indicators for the
MetS in both genders. For men, the ability of WC to predict
at least two other indicators of the MetS revealed a sensitivity
of 69.1% and specificity of 90.8%, and AUC of 0.85, giving a
cut-off point of ≥ 91.0 cm (Fig. 1). Furthermore, the AUC for
the women was 0.76, with a sensitivity of 88.6% and specificity
of 58.9%, yielding a cut-off point of ≥ 82.3 cm (Fig. 2).
The prevalence of AO, as determined by the two cut-off
values of the IDF and the current study, was similar at 47.9
and 47.4%. Differences in the prevalence were observed when
the data were further analysed according to gender. When the
prevalence of AO was defined by the IDF cut-off values, there
was a 5.8% increase in the prevalence of AO among men (from
24.5 to 30.3% when using the new cut-off values) and a 4.6%
increase in the prevalence of the MetS (from 19.9 to 24.5% using
the new cut-off values) (Table 2). For the women there was a
6.3% decrease in the prevalence of AO (69.6 to 63.3% using the
new cut-off values) and a 3.0% decrease in the prevalence of the
MetS (from 44.5 to 41.5% using the new cut-off values) (Table 2).
Discussion
The results from this survey indicate a difference between the WC
cut-off points used for Europeans for determining AO and the
currently determined cut-off points for Batswana adults (≥ 94 cm
vs ≥ 91 cm for men and ≥ 80 cm vs ≥ 82 cm for women). Gender
differences became more noticeable when data were further
analysed by gender, which led to different estimated prevalences
Table 1. Participants’ characteristics by gender
Characteristic
Number
All
Men
Women
p
-value
Number (%)
800
384 (48)
416 (52)
Age (years)
743
36.1 ± 8.9
36.3 ± 9.2
35.9 ± 8.6
0.583
BMI (kg/m
2
)
797
26.2 ± 5.7
24.2 ± 4.5
27.9 ± 6.1
< 0.001
WC (cm)
794
85.1 ± 13.9
84.1 ± 13.3
86.0 ± 14.4
0.05
HC (cm)
795
104.2 ± 12.8
99.6 ± 10.5
108.5 ± 13.3
< 0.001
WHR
794
0.82 ± 0.1
0.85 ± 0.11
0.79 ± 0.11
< 0.001
Systolic BP (mmHg)
795
127.5 ± 16.9
130.4 ± 16.7
124.7 ± 16.6
< 0.001
Diastolic BP (mmHg)
795
78.8 ± 10.8
79.2 ± 11.0
78.5 ± 10.7
0.378
BMI (%)
25
≤
BMI < 30 kg/m
2
232
29.1
15.1
31.0
< 0.001
BMI
≥
30 kg/m
2
192
24.1
13.0
34.4
< 0.001
WC, men/women (%)
≥
94/80 cm
380
47.9
24.5
69.6
< 0.001
≥
102/88 cm
230
29.0
11.0
45.7
< 0.001
WHR > 1.0/0.85
106
13.4
3.7
22.6
< 0.001
Elevated BP,
≥
130/
≥
85 mmHg (%)
355
44.7
50.3
39.4
0.002
BG, mmol/l (%)
779
5.3 ± 1.3
5.3 ± 1.2
5.4 ± 1.5
0.201
≥
5.6 mmol/l (%)
251
32.2
29.9
34.2
0.207
TG, mmol/l (%)
785
1.9 ± 2.4
1.8 ± 1.0
2.0 ± 1.1
0.057
≥
1.7 mmol/l (%)
372
47.4
46.3
48.4
HDL-C
778
1.2 ± 0.4
1.1 ± 0.4
1.3 ± 0.4
< 0.001
< 1.03/1.29 mmol/l (%)
384
49.4
48.7
50.0
MetS (%)
787
32.7
20.0
44.5
< 0.001
BMI, body mass index; WC, waist circumference; HC, hip circumference; WHR, waist–hip ratie; BP, blood pressure; BG, blood glucose; TG, triglycerides; HDL-C,
high-density lipoprotein cholesterol; MetS, metabolic syndrome.
100-Specificity
100
80
60
40
20
0
0
20
40
60
80
100
Sensitivity
M9: Waist circumference
C1 = 0
Sensitivity: 69.1
Specificity: 90.8
Criterion: >91
Fig. 1.
ROC curve for the WC of males.