


 42 / 64

CARDIOVASCULAR JOURNAL OF AFRICA • Volume 31, No 6, November/December 2020
322
AFRICA
to 41%,
11,16
to our knowledge this is the first study reporting
the prevalence of blood glucose levels at admission and their
prognostic value on in-hospital mortality in our practice. The
prevalence of admission hyperglycaemia (40.6%) was higher
than the prevalence of DM (28.4%). This high rate of acute
hyperglycaemia is consistent with available data in the literature
in wealthy countries, where the prevalence of hyperglycaemia
> 140 mg/dl (7.8 mmol/l) ranges from 39 to 58%.
1,2,5
However,
the blood glucose cut-off point differs across studies, and it
has been reported that up to 71% of ACS patients had acute
hyperglycaemia.
3
The prognostic impact of hyperglycaemia on admission in
patients hospitalised for ACS has been established in numerous
studies.
7-10
The Cooperative Cardiovascular Project
7
is the most
important registry (
n
=
141 680) that evaluated the relationship
between mortality rate and admission blood glucose after ACS.
Mortality at 30 days and one year evolved linearly with blood
glucose levels at admission (≤ 110, 110–140, 140–170, 170–240
and
≥
240 mg/dl) (6.11, 6.11–7.8, 7.8–9.44, 9.44–13.32 and
≥
13.32 mmol/l). As in our study, the risk of mortality was higher
in patients without a history of DM.
7
In a recent meta-analysis including 214 219 patients, admission
hyperglycaemia significantly increased hospital mortality rate
(HR
=
3.62;
p
<
0.0001), and this impact persisted at 30 days
(HR
=
4.81,
p
<
0.0001) and long term up to 108 months (HR
=
2.02,
p
<
0.0001).
3
In STEMI patients who underwent primary
PCI, hyperglycaemia was associated with a higher rate of
complications and mortality, including the risk of recurrence of
myocardial infarction and heart failure.
17
In patients without a history of DM, raised blood glucose
may correspond to a pre-diabetic state unmasked under a
stressful, acute post-ACS phase. In the GAMI trial, OGTT was
systematically performed in the follow up of 181 patients with
acute myocardial infarction, no history of DM and an admission
blood glucose level
<
11.0 mmol/l. This study found 67% of new
cases of DM and impaired glucose intolerance (IGT).
18
The potential mechanisms involved with acute hyperglycaemia
are still poorly understood, but some hypotheses have been
suggested.
4,5
Hyperglycaemia may be a cause or ‘marker’ of
Table 4. Predictors of in–hospital death in patients with diabetes.
Multivariate analysis.
Predictors
Initial model
Final model
HR 95% CI
p
-value HR 95% CI
p
–value
Dyslipidaemia 0.78 0.28–2.16
0.63
Congestive heart
failure
6.43 2.12–19.54 0.04 5.74 2.68–12.30
<
0.001
LVEF
<
40% 1.12 0.42–3.00
0.83
STEMI
1.40 0.36–5.36
0.63
SVT/VF
15.11 1.88–121.20 0.01 10.09 1.41–72.27 0.02
Cardiogenic
shock
29.24 6.83–125.11
<
0.001 23.75 7.60–74.27
<
0.001
DAPT
0.80 0.26–2.41
0.69
PCI
1.07 0.29–3.89
0.92
m (IQR): median (interquartile range). HR: hazard ratio. 95% CI: 95% confi-
dence interval. LVEF: left ventricular ejection fraction. STEMI: ST-segment
elevation myocardial infarction. SVT/VF: sustained ventricular tachycardia/
ventricular fibrillation. DAPT: dual antiplatelet therapy. PCI: percutaneous coro-
nary intervention.
Table 5. Predictors of in-hospital death in patients without diabetes.
Multivariate analysis
Predictors
Initial model
Final model
HR 95% CI
p
-value HR 95% CI
p
-value
Age
>
60 years
2.39 1.27–4.49 0.007 2.46 1.35–4.49 0.003
Female gender
0.77 0.37–1.6
0.48
Hypertension
1.17 0.60–2.25 0.65
Dyslipidaemia
0.53 0.24–1.16 0.11
History of MI
0.15 0.02–1.32 0.09
Congestive heart
failure
1.44 0.76–2.74 0.27
LVEF
<
40%
8.71 4.05–18.70 0.15 10.18 4.93–21.00
<
0.001
Anterior ACS
1.53 0.78–3.01 0.22
Admission
hyperglycaemia
2.65 1.41–4.99 0.002 3.12 1.72–5.68
<
0.001
STEMI
1.34 0.54–3.30 0.99
SVT/VF
3.59 1.21–10.64 0.021
Cardiogenic shock 7.33 2.81–19.08
<
0.001 9.05 3.66–22.33
<
0.001
PCI
0.27 0.09–0.83 0.022 0.29 0.10–0.86 0.02
HR: hazard ratio. 95% CI: 95% confidence interval. MI: myocardial infarction.
ACS: acute coronary syndrome. LVEF: left ventricular ejection fraction. ACS:
acute coronary syndrome. STEMI: ST-segment elevation myocardial infarction.
SVT/VF: sustained ventricular tachycardia/ventricular fibrillation. PCI: percuta-
neous coronary intervention.
Table 6. Predictors of in-hospital death from 2002–2010.
Multivariate analysis
Predictors
HR 95% CI
p
-value
Diabetes mellitus
4.79 1.86–12.36 0.001
Congestive heart failure
4.51 1.74–11.70 0.001
Cardiogenic shock
6.10 1.61–23.05 0.008
HR: hazard ratio. 95% CI: 95% confidence interval.
Table 7. Predictors of in-hospital death from 2011–2017.
Multivariate analysis
Predictors
HR 95% CI
p
-value
Admission hyperglycaemia
2.57 1.52–4.32
<
0.001
Congestive heart failure
3.40 2.05–5.64
<
0.001
Cardiogenic shock
14.41 6.82–30.42
<
0.001
HR: hazard ratio. 95% CI: 95% confidence interval.
0.0 0.2 0.4 0.6 0.8 1.0
1.0
0.8
0.6
0.4
0.2
0.0
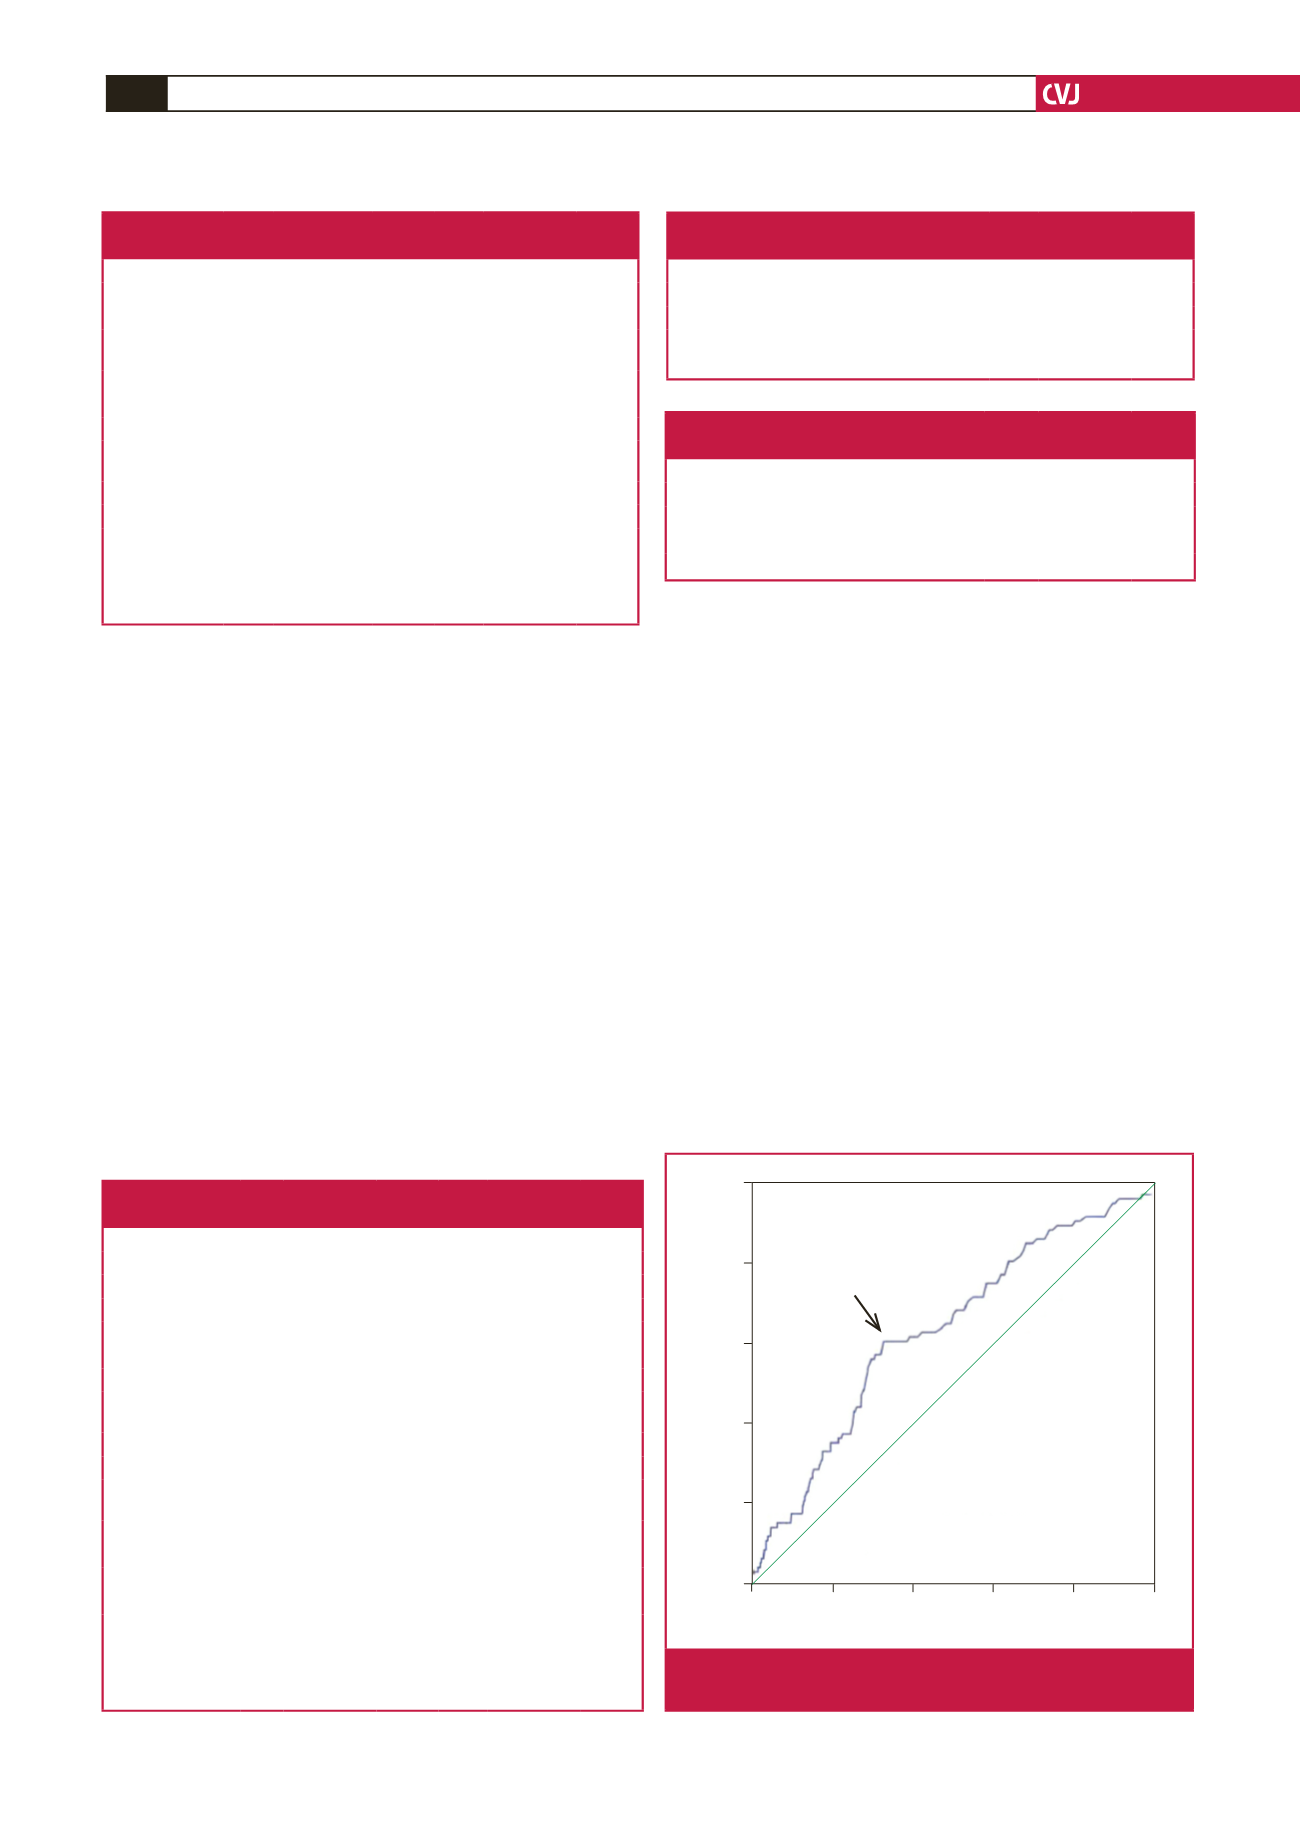
Cut-off: 1.515 g/l
Sensitivity
1 – Specificity
AUC = 0.636;
p
< 0.001
Sensitivity = 61%, Specificity = 67%
Fig. 1.
ROC curve showing glycaemia cut-off value predictive
for in-hospital death.