
CARDIOVASCULAR JOURNAL OF AFRICA • Volume 32, No 4, July/August 2021
AFRICA
195
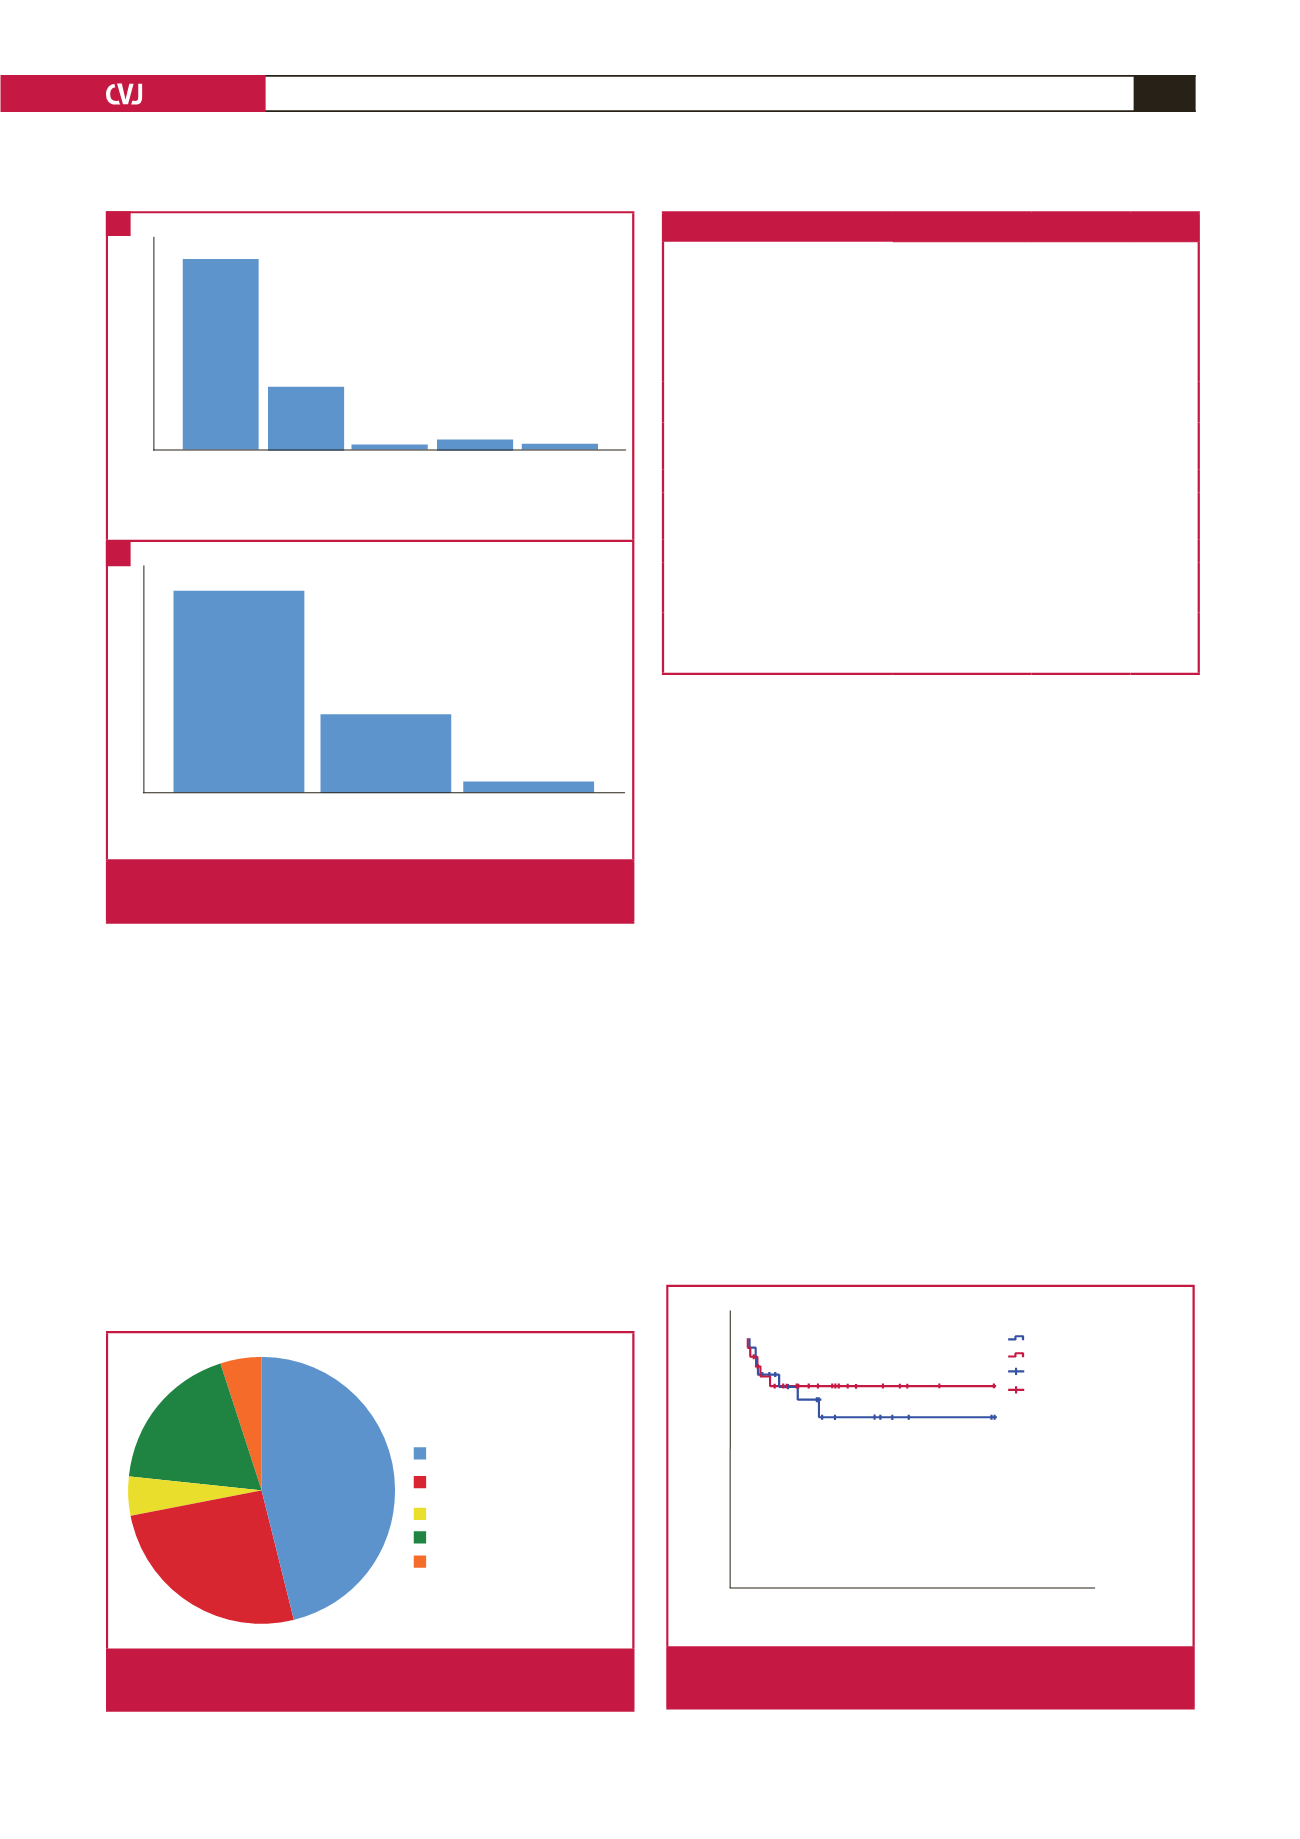
a snare. The overall one-year mortality rate after lead removal
was 19.1% (19.2% in the extraction group vs 14.8% in the
explant group) (
p
= 0.764). There was no difference in survival
rate between patients who had their CIEDs extracted versus
explanted (Fig. 3).
Discussion
The key findings of this study are: (1) CIED-related infection
was the leading indication for CIED removal (extraction or
and explant) at a tertiary referral centre in South Africa; (2)
percutaneous tranvenous lead extraction using a locking stylet
with or without mechanical extraction sheaths had a high
procedural and clinical success rate; (3) percutaneous lead
removal was associated with a low risk of major and minor
complications and low mortality rate, which is comparable with
high-volume centres in Europe and North America; and (4)
the overall one-year mortality rate remained high, similar to
previous reports.
The implantation rates of CIEDs are increasing globally and
in low- to middle-income countries such as South Africa.
9,10,18
The
rates of CIED removal, particularly for CIED infection, have
also been on the rise.
8,12
The findings of this study are consistent
with the current international standard of extraction procedural
success rate of more than 80%, clinical success rate of more than
95% and major complication rate of less than 5%.
11,13
Although patients who underwent lead extraction in this
study had a low in-hospital mortality rate of 3.8%, we found
that the one-year mortality rate was 19.2%. These findings are
consistent with a study by Maytin
et al
., who reported a 30-day
mortality rate of 2.1%, one-year mortality rate of 8.4% and
a 10-year mortality rate of 46.8% in patients who had their
leads extracted.
19
Therefore, although the in-hospital mortality
rate and minor and major complication rates related to lead
Table 2. Lead-removal procedure details and outcomes
Variables
Removal (extraction
and explant)
(
n
= 53)
Extraction
(
n
= 26)
Explant
(
n
= 27)
Days since primary implantation,
median (IQR)
243 (53–831)
831
(359.5–2546)
57
(36–104)
Total number of removed leads,
mean (SD)
75
40
35
Number of removed leads per
patient
1.42 (0.69)
1.54 (0.76) 1.3 (0.61)
Locking stylet,
n
(%)
24 (45.3)
24 (92.3)
0
Extraction sheath,
n
(%)
19 (35.8)
19 (73.1)
0
Straight stylet,
n
(%)
27 (50.9)
26 (100)
25 (92.6)
Procedural success,
n
(%)
49 (92.5)
22 (84.6)
27 (100)
Clinical success,
n
(%)
53 (100)
25 (96.2)
27 (100)
Major complications,
n
(%)*
1 (1.9)
1 (3.8)
0
Minor complications,
n
(%)
#
1 (1.9)
1 (3.8)
0
In-hospital mortality,
n
(%)
1 (1.9)
1 (3.8)
0
*There was one death, which was recorded as a major complication.
#
One minor complication was a lead-fragment embolism to the lung without
complications.
Culture
Culture negative
Methicillin-susceptible
staphylococci
Pseudomonas aeruginosa
Staphyhylococcus epidermis
Escherichia coli
2.70%
48.65%
18.92%
27.03%
2.70%
Fig. 2.
Pie chart depicting the frequency of causative micro-
organisms for CIED infection leading to CIED removal.
Infection Lead
malfunction
Lead
dislodgement
Arrythmia RV
perforation
Indication for removal
Percentage
20
40
60
0
Percentage
0
20
40
60
Infection
Lead malfunction Lead dislodgement
Indication for extraction
Fig. 1.
A. Bar chart depicting indications for CIED removal.
B. Bar chart depicting indications for CIED extraction.
A
B
Follow up in days
Log rank = 0.287
Culumative survival
1.0
0.8
0.6
0.4
0.2
0.0
0
1000
2000
3000
4000
Explant
Extration – censored
Explant – censored
Extraction
Fig. 3.
Kaplan–Meier curves depicting the cumulative survival
difference between the extraction and explant group.


