


 29 / 61

CARDIOVASCULAR JOURNAL OF AFRICA • Volume 32, No 4, July/August 2021
AFRICA
201
Factors affecting knowledge level and TLC
implementation
Regarding participants’ level of knowledge on hypertension,
males were found to be more knowledgeable than females (
p
= 0.021), and those with a higher education level also had
significantly better knowledge scores than other participants of
lower educational status (
p
= 0.001). Also, patients who reported
their consultation time to be more than 10 minutes had greater
knowledge levels than those who reported their consultation to
have taken less time (Fig. 8). No associations were found between
age, marital status, occupation, previous cardiovascular events
and knowledge level.
Concerning overall TLC implementation level, socio-
demographic factors, previous cardiovascular events,
consultation times or even knowledge level did not prove to be
associated factors, with no statistically significant differences
being recorded between the different groups.
Discussion
Hypertension is a public health issue of utmost importance,
as it is a major reversible risk factor for heart attack, renal
failure and stroke. Being a reversible risk factor, the priority in
medical research endeavours should be finding new and more
effective measures to control hypertension and prevent related
complications.
Lifestyle modifications are a suitable primary healthcare
measure in the control of hypertension and prevention of its
sequelae,
2
as well as a suitable adjunct to medical therapy. The
issue with the implementation of TLC is ensuring patients
have both adequate knowledge and motivation to adopt these
lifestyles. This cross-sectional, descriptive study conducted in
Ahmed Gasim Hospital and Al-Shaab Teaching Hospital in
Khartoum state aimed to assess patients’ level of knowledge,
Full
implementation
Good
implementation
Poor
implementation
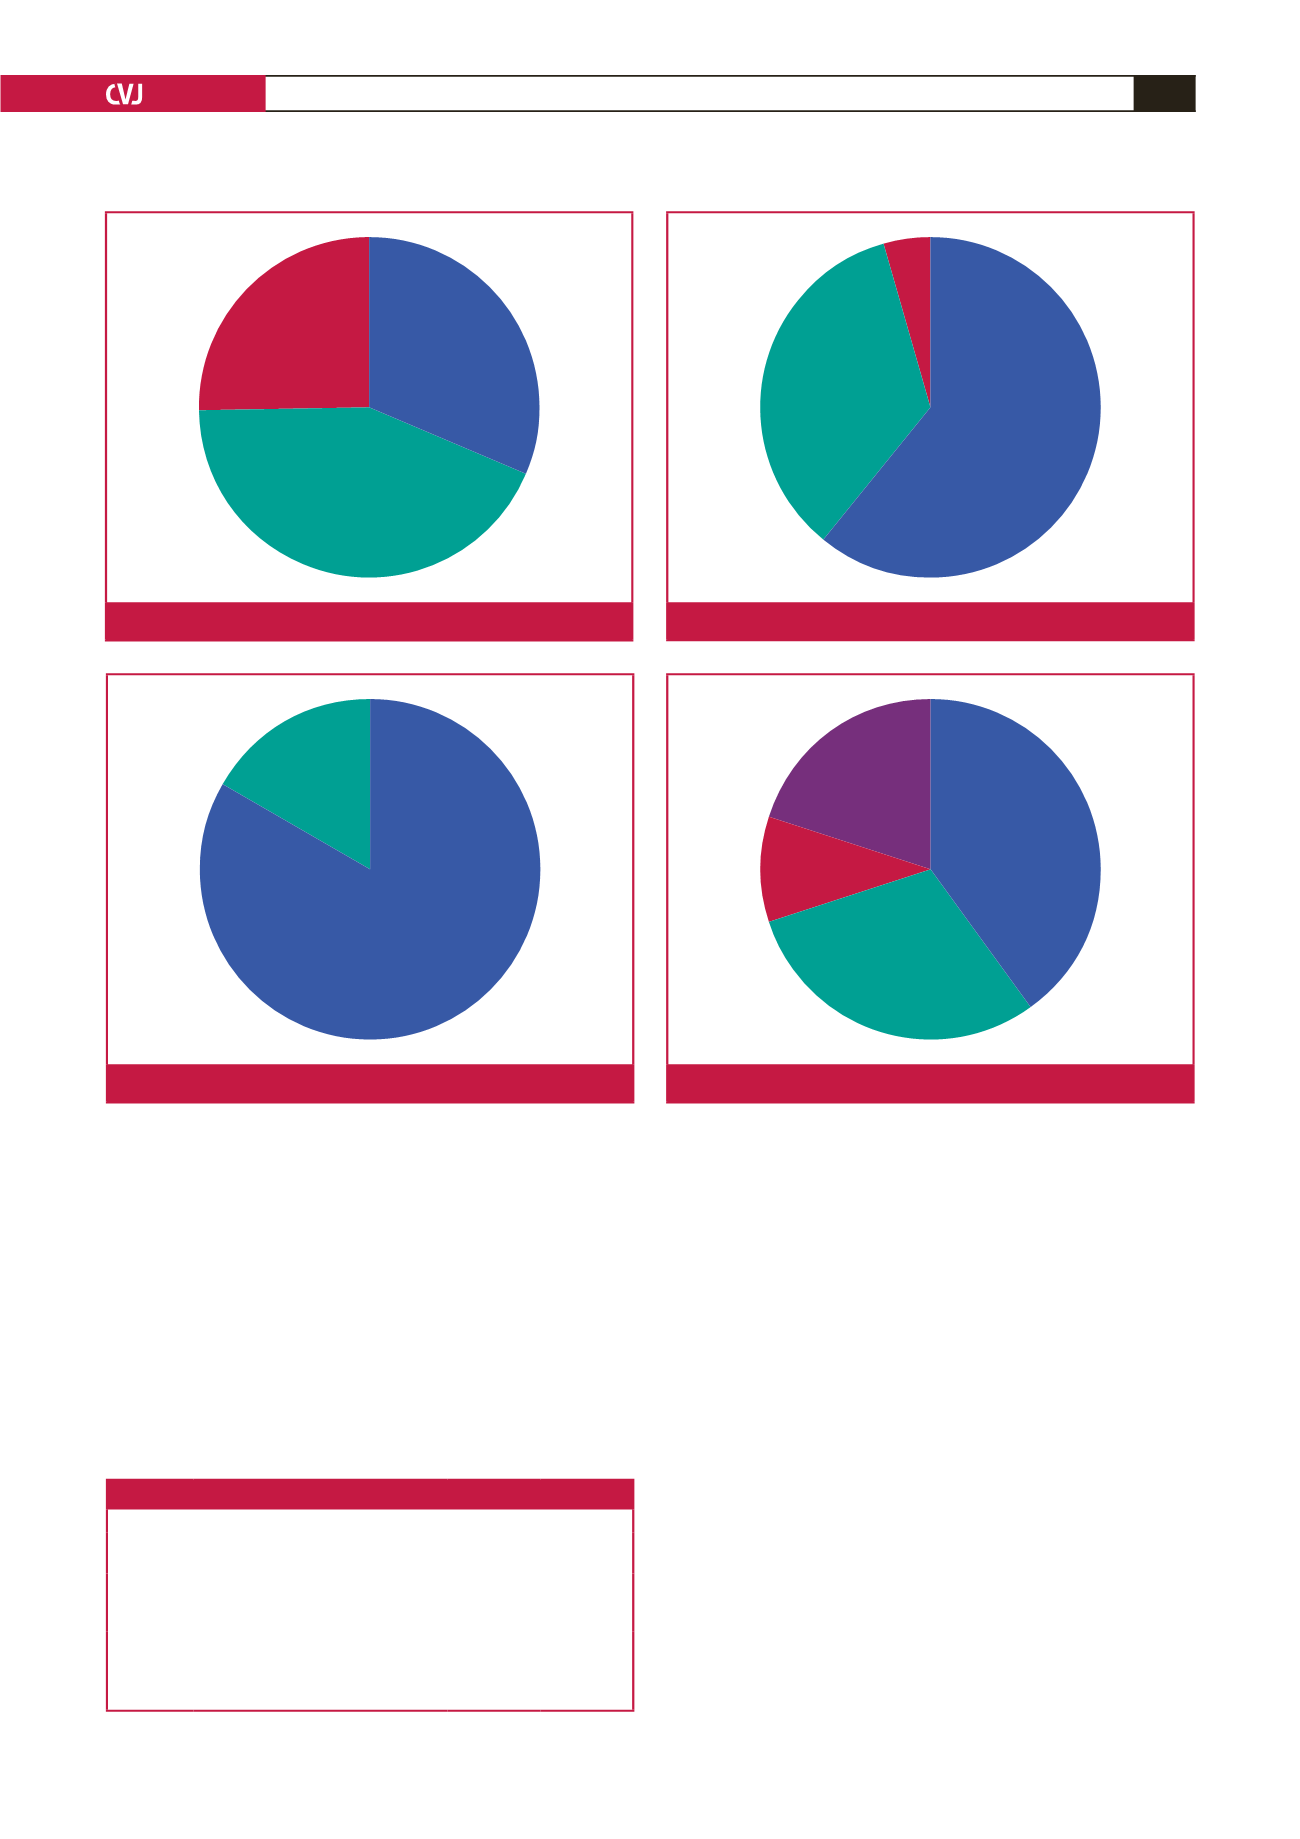
Fig. 4.
Overall TLC implementation level.
Table 5. Patients’ perceived barriers to TLC implementation
TLC
Perceived barrier
Number
Percentage
Minimising
salt intake
Don’t think it matters
No time
14
3
82.4
17.6
Weight loss
Don’t think it matters
Too difficult
Other
16
8
1
64
32
4
Regular
exercise
Don’t think it matters
No time
No facilities
Too difficult
27
19
6
13
41.5
29.2
9.2
20
Don’t think it matters
No time
Fig. 5.
Perceived barriers to minimising salt intake.
Don’t think
it matters
Too difficult
Other
Fig. 6.
Barriers to weight loss.
Don’t think
it matters
No time
No facilities
Too difficult
Fig. 7.
Barriers to exercise.